The Elliott Wave Theory is an effective form of technical analysis for understanding market trends and price movements, based on the idea that “markets move in cycles of impulsive and corrective waves, forming a complete pattern of eight waves.”
The foundation of this theory lies in the assumption that “market waves reflect human psychology,” and each wave count is believed to be closely tied to collective investor sentiment.

Like when you’re thinking, ‘Go up, come on!’ or ‘I’m in the red… what do I do?’ or ‘It can’t go any lower than this, right?’ — those kinds of thoughts and emotions show up in price movements?

Yeah, that’s pretty much it. The trades people make out of hope or fear show up as price action in the market.
By applying knowledge of the Elliott Wave Theory and considering the characteristics of each wave along with the corresponding market psychology,
you can make informed decisions such as:
- whether to trade in line with the market trend,
- whether to take a contrarian position against the trend,
- or whether to stay on the sidelines and wait for a clearer signal.
There’s a saying in trading: “Sometimes the best trade is no trade.”
Elliott Wave analysis can serve as a useful tool in determining whether now might be the right time to step back and stay out of the market.
Elliott Waves Made Simple: Master Elliott Waves Techniques In Less Than 48 Hours
In this article, we’ll explain the collective market psychology inferred from each wave count in the Elliott Wave Theory.
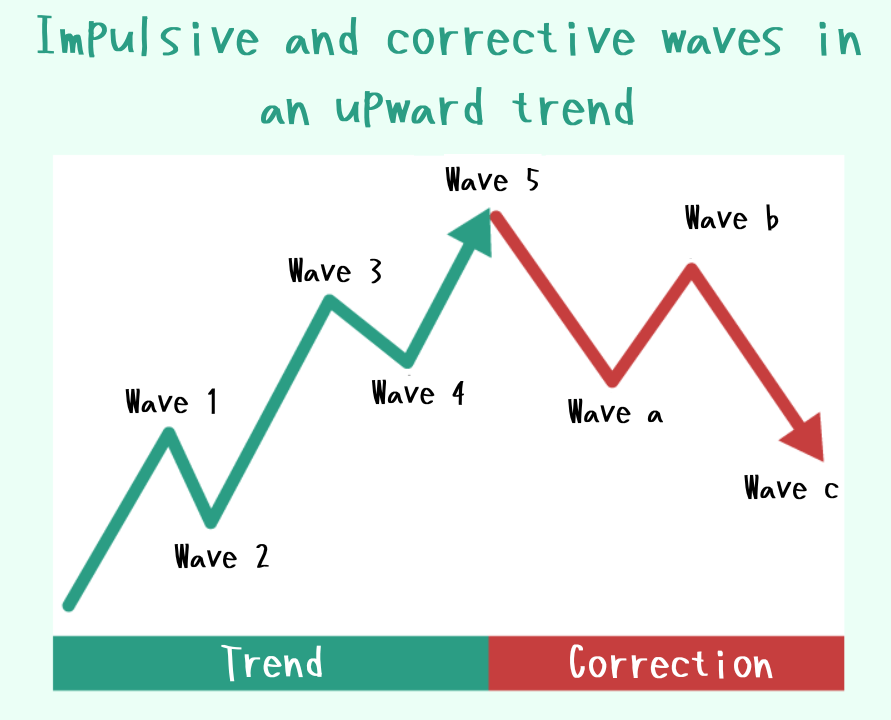
To make the explanation easier to follow, we’ll use a market example composed of an upward trend with impulsive waves 1 through 5, followed by a downward correction consisting of corrective waves A through C.
I use “XMTRADING” as my trading tool.

It is my personal most trusted trading account and is used by many professional traders.
I use “TradingView” as my analysis tool.
Registering an account gives you access to many features for free.
Wave 1: The Beginning of a Trend
In Elliott Wave Theory, Wave 1 marks the starting point of a new trend.
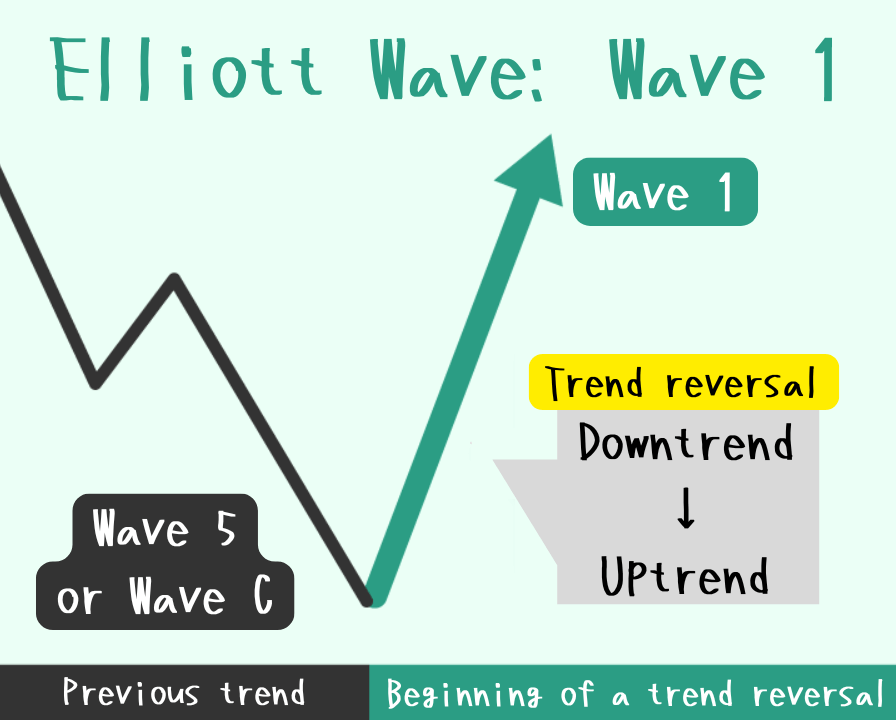
On the surface, it may still appear that the downtrend is continuing, but in reality, the market is beginning to shift into a new upward trend.
From a psychological standpoint, most market participants are likely thinking along the following lines.
 A
ADowntrend is still continuing.
BThis upward move has got to be just temporary!
CMaybe I should take my profits now.
At this stage, it is also common for the market fundamentals to appear weak.
However, unlike a simple price correction during a downtrend, the impulsive Wave 1 has several distinctive characteristics, such as the following:
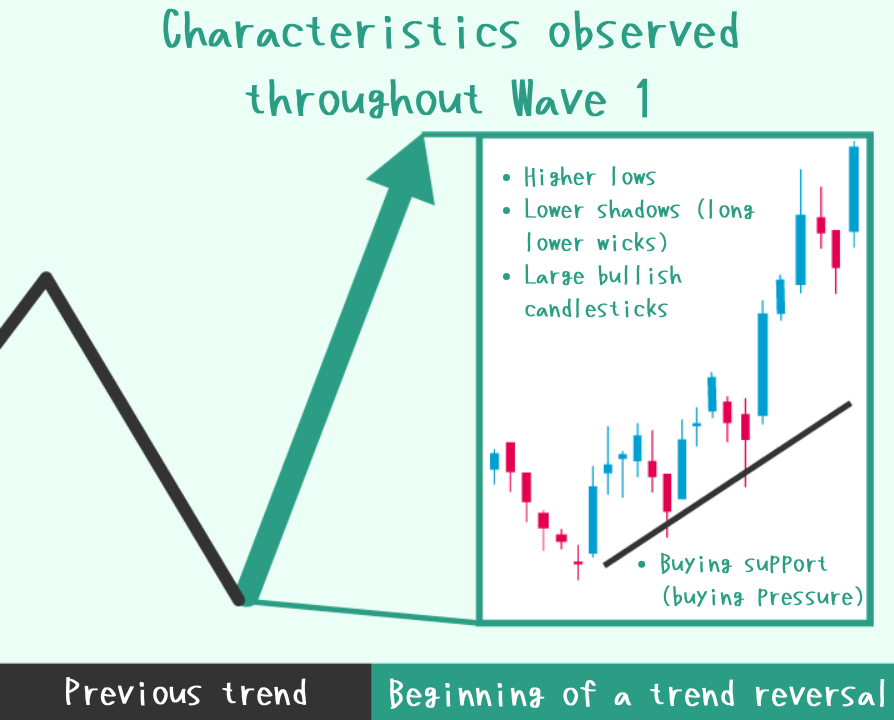
- The appearance of large bullish candlesticks.
- Increasing support for buying.
- Sharp rises caused by short covering after significant declines.
Wave 1 can sometimes start suddenly and unexpectedly, making it difficult to enter trades at its early stage because contrarian trading is considered high risk.
Generally, it is only after Wave 2 has formed and completed that traders can often confirm that the previous upward movement was indeed Wave 1.
The start of Wave 1 can also be seen as the end of the downtrend.
In that case, it might be more reliable to try predicting the end of Wave C rather than searching for Wave 1.
Wave 2: The Corrective Wave (Often a Price Adjustment)
In Elliott Wave Theory, Wave 2 is a wave where a significant price correction is likely to occur.
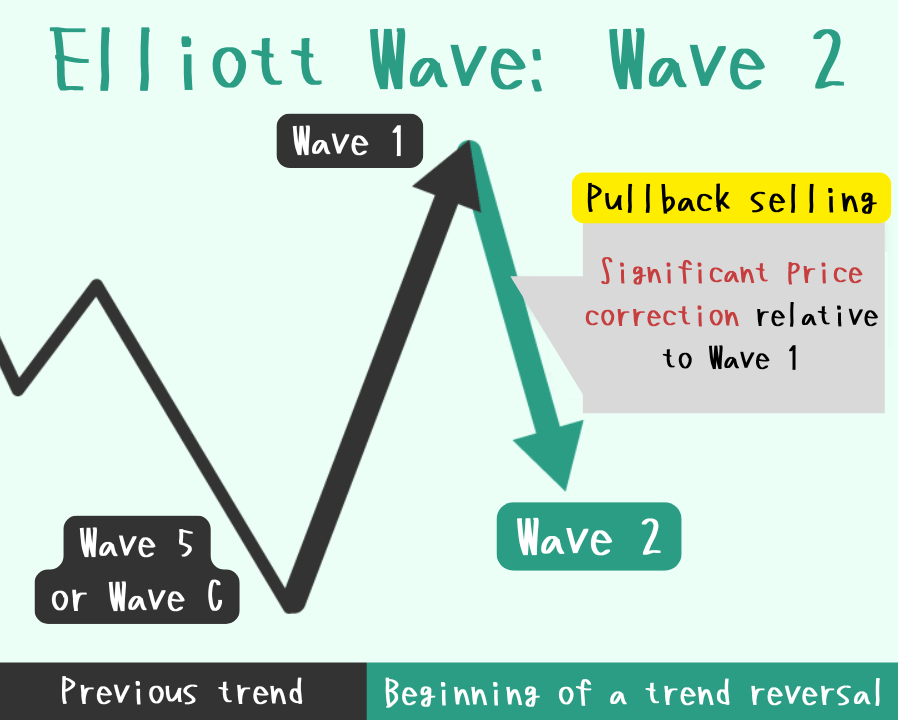
The price increase seen in Wave 1 is typically followed by a significant correction, driven by “selling on the rally” from participants who still expect the downtrend to continue.
At this stage, market participants are likely to experience doubts and concerns such as the following:
AJust when it looked like the price was rising, a sharp drop began again.
BI knew it—this downtrend isn’t over yet!
CIt might even break the previous low…
However, although the price correction in Wave 2 can be significant, this wave generally does not fall below the starting point of Wave 1.
Traders typically use Fibonacci retracement levels of Wave 1 to estimate where Wave 2 might end.
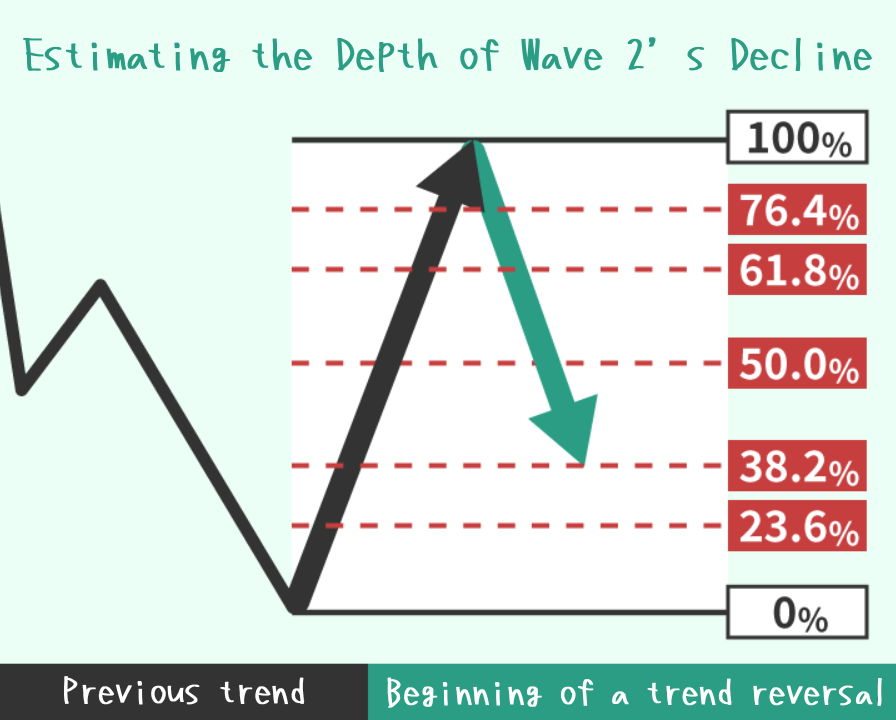
- 23.6%–38.2% retracement: Indicates strong selling pressure.
- 50.0%–61.8% retracement: Considered a typical correction level; widely monitored by many traders.
- Retracement down to 76.4%: Suggests weak corrective power and strong expectations for a continued uptrend.
If the price falls all the way back to the starting point of Wave 1, it indicates that the wave count may be incorrect and the analysis should be reconsidered.
Wave 3: The Strongest Price Expansion Wave
In Elliott Wave Theory, Wave 3 is the most likely to produce the largest price increase.
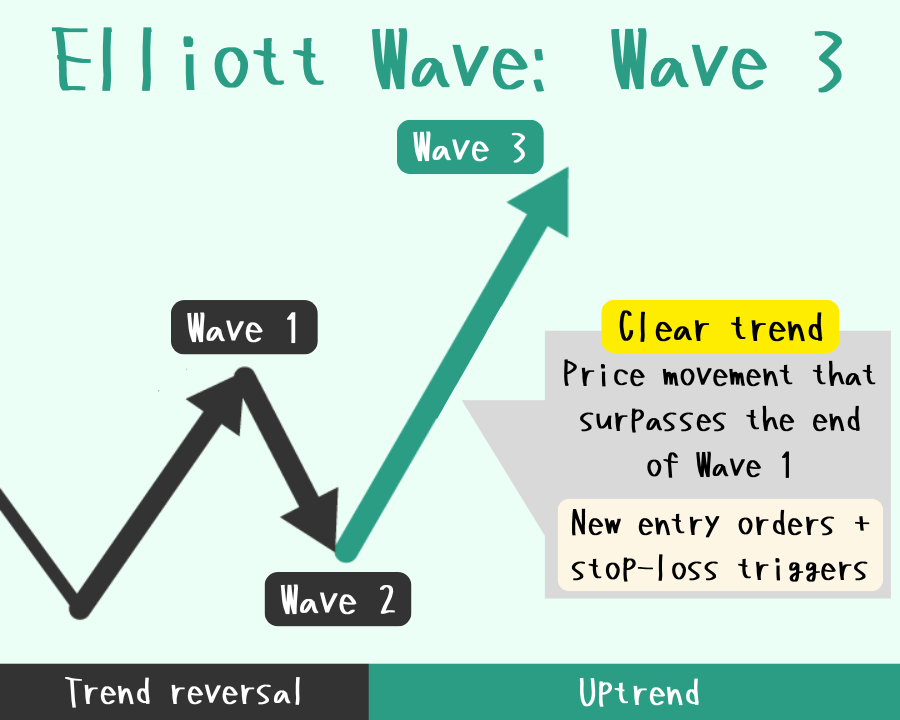
Since Wave 2 did not fall below the starting point of Wave 1, a growing number of market participants begin to recognize that a trend reversal may have occurred.
In the case of an upward price movement, new buy orders start to flood in, while stop-loss orders from the sell side are triggered. This buying pressure drives the price sharply higher.
At this stage, market participants are likely to be filled with a mix of hopes and concerns such as the following:
AThe trend has changed!
BI’ll look to buy on the dips.
CThe market kept falling before… maybe this is just a fake breakout?
Additionally, from both fundamental and technical perspectives, indicators often emerge that support the upward trend, along with bullish statements and buy signals.
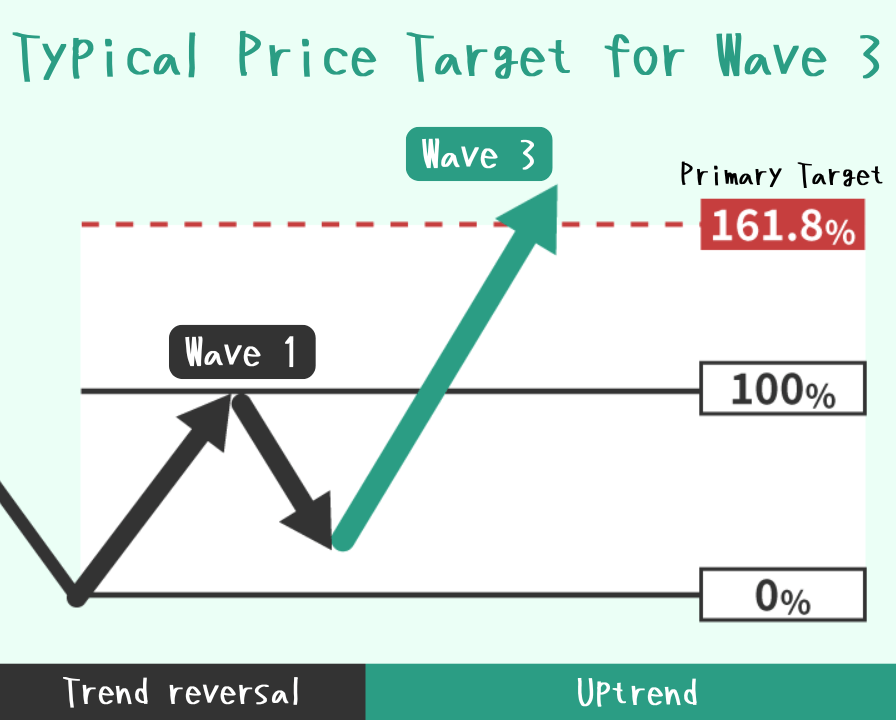
The typical target price for Wave 3 corresponds to the 161.8% Fibonacci extension of the Wave 1 price increase.
If the wave pattern is an “impulse,” an “extension” may occur, causing the price to rise beyond 161.8%, with the next target level around the 261.8% Fibonacci extension.
Of course, there are cases where a “diagonal” pattern forms as well.
Wave 4: The Time Correction Wave (Often a Pause)
In Elliott Wave Theory, Wave 4 is most likely to appear as a time-based correction, where prices move sideways rather than sharply up or down.
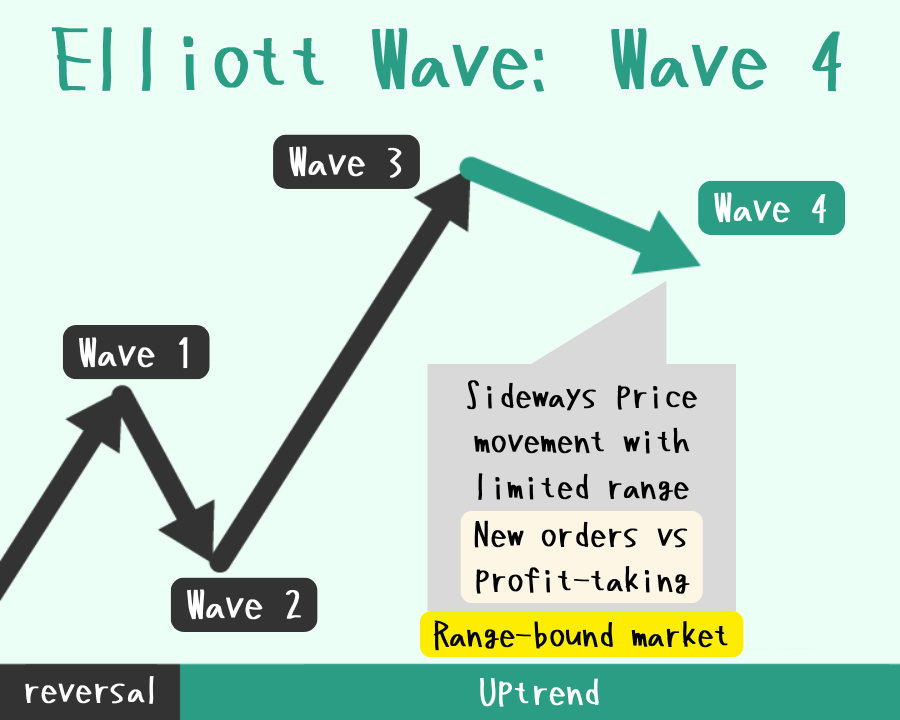
The movement in Wave 3 often experiences a temporary pause, where profit-taking sells and new buying pressure oppose each other, causing the price to move sideways. This typically forms what is known as a range-bound market.
Note: Of course, price corrections similar to those in Wave 2 can also occur.
From a psychological perspective, market participants are likely feeling the following:
AThe uptrend is over. I’ll sell to take profits.
BThere’s still room to go up, so I’ll buy!
CThe price has risen quite a bit, so I want to wait and see for now.
When fundamentals are already priced in and no new factors emerge, it becomes difficult for new buyers or sellers to enter the market.
As a result, price movements often become complex, forming prolonged range-bound markets.
When a range-bound market occurs, the price often transitions into Wave 5 once new fundamental factors arise.
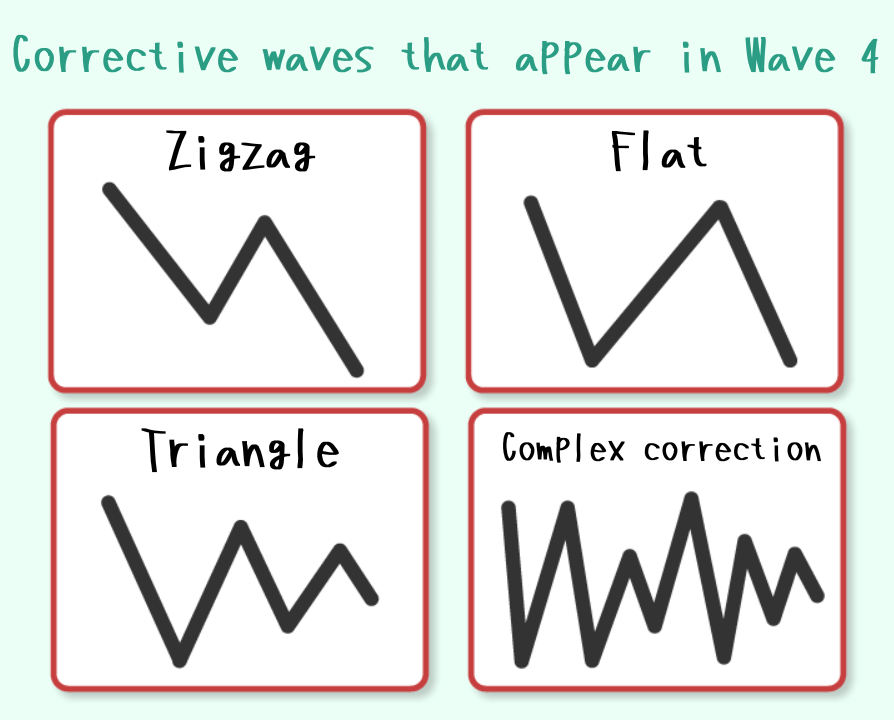
There are various possible wave patterns like flats, triangles, complex corrections, and zigzags, which tend to make price movements more complicated.
It seems really difficult to count Wave 4 in real time or to use it effectively to extend profits.
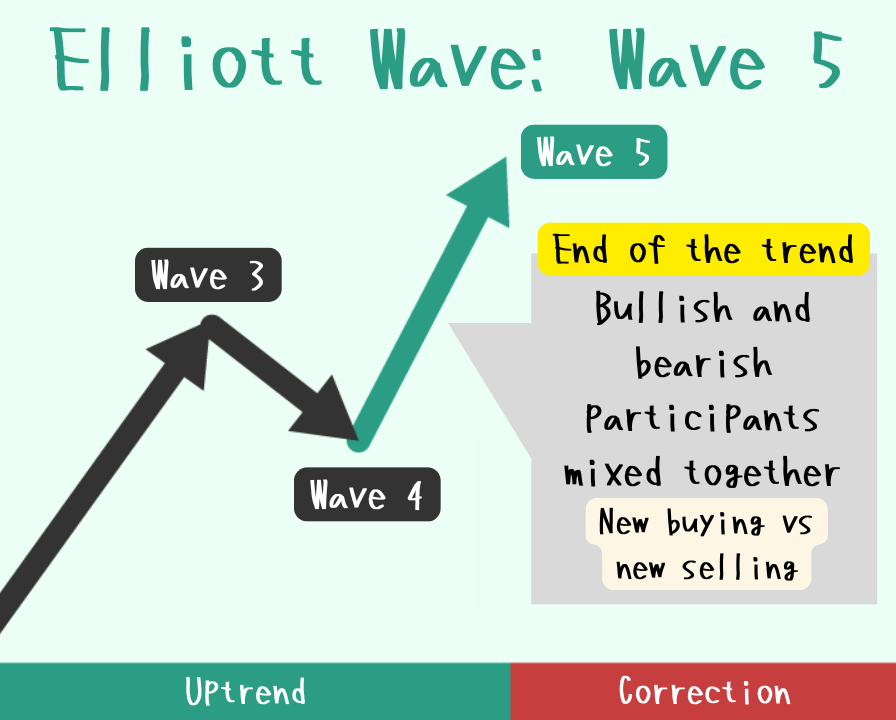
Wave 5: The Final Wave of the Trend
Wave 5 is the last wave of the trend and can show either a strong upward movement or a weak rally.
Whether the upward movement in Wave 5 is strong or weak depends on fundamental factors at the time and the positioning of stops.
For example, if there are favorable fundamentals supporting the trend or a large number of stop-loss orders in place, the price tends to rise strongly.
From a psychological standpoint, market participants are often a mix of bullish and bearish sentiments at this stage.
AI want to hold my winning position longer and maximize profits.
BI’m going to jump in with the trend and chase more profits!
CIt’s risen enough already; I’ll take my profits.
DIt’s way too high now. I’ll go contrarian! (But it’s scary, so I’ll set a stop-loss if it breaks the high.)
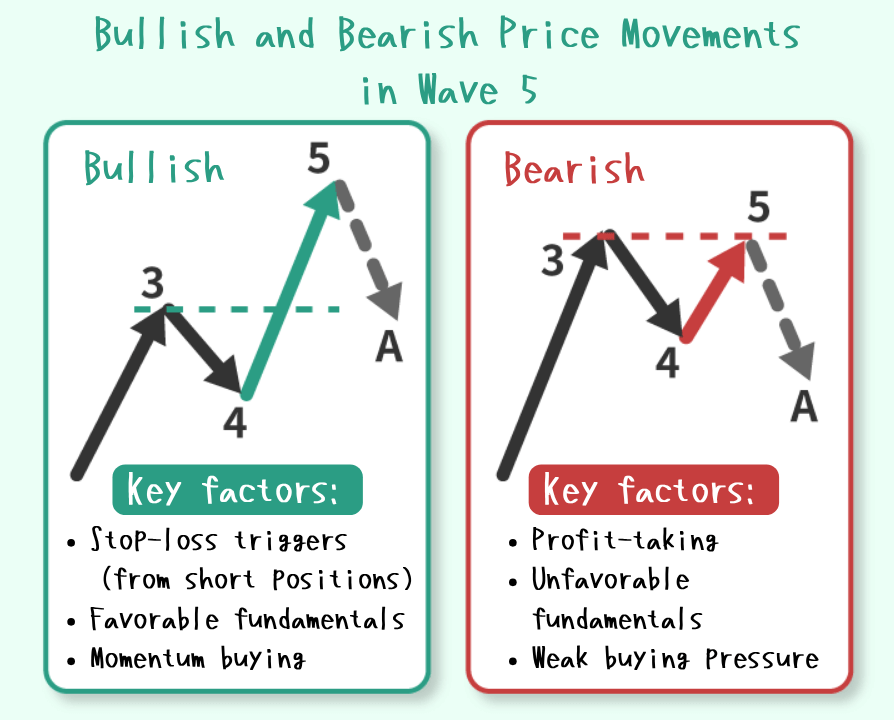
Because market sentiment is mixed at this stage, prices may not rise as strongly as expected.
In particular, when Wave 5 fails to surpass the high of Wave 3, it is called a “failure” (or “fifth wave failure”) and is often seen as a pattern that forms a double top.
It can be difficult to judge whether prices will continue to rise, and holding onto positions too aggressively in line with the trend may result in significant losses during the following corrective wave—Wave A.
On the other hand, when many traders—like Participant D—take contrarian positions and quickly stop out, Wave 5 tends to grind higher and become larger.
Yeah, that happens. Sometimes the price just keeps rising (or falling) without even forming a pullback.
Wave A: The Reversal Wave
In Elliott Wave Theory, the first wave of a three-wave correction is called Wave A.
This wave is often referred to as the “trend reversal wave” because it moves significantly in the opposite direction of the preceding trend formed by Waves 1 through 5.
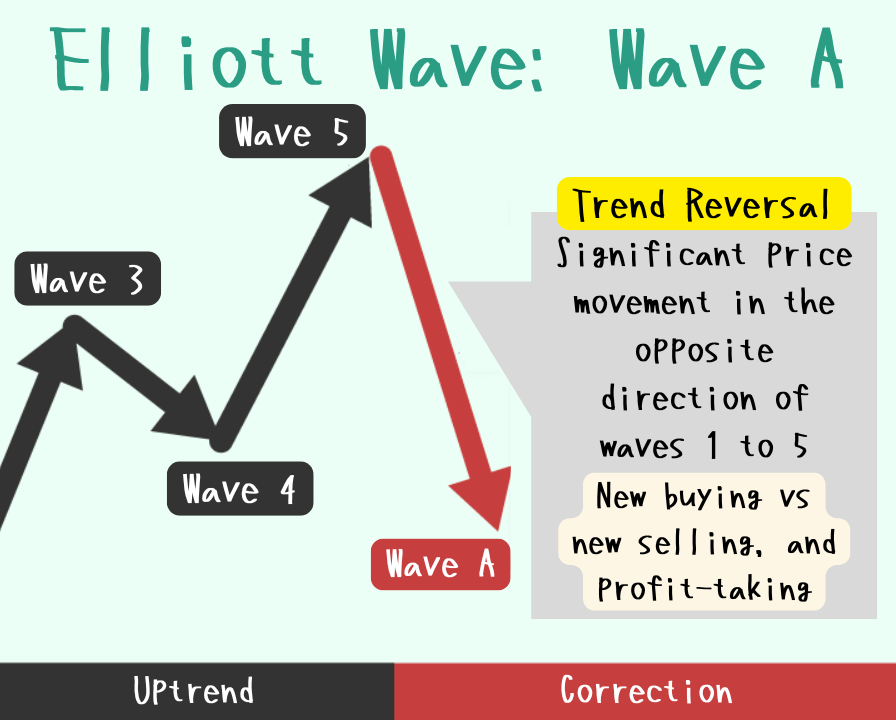
Wave A marks the beginning of a trend reversal. If waves 1 through 5 formed an uptrend, then waves A through C typically form a downtrend.
Since wave A initiates a new impulsive move, it often results in a larger price decline compared to the corrective pullbacks seen in waves 2 or 4 during the previous uptrend.
The market sentiment among participants during wave A can be interpreted as follows:
AThis is just a temporary correction in the trend.
BI think the trend is over, so I’ll try counter-trading.
CBetter take profits around here before my unrealized gains shrink.
While some new participants enter the market during Wave 5, expecting the trend to continue based on the price movement, others who had entered earlier begin to take profits during Wave 5.
At the same time, more counter-trend traders start to enter the market, increasing the pressure for a trend reversal.
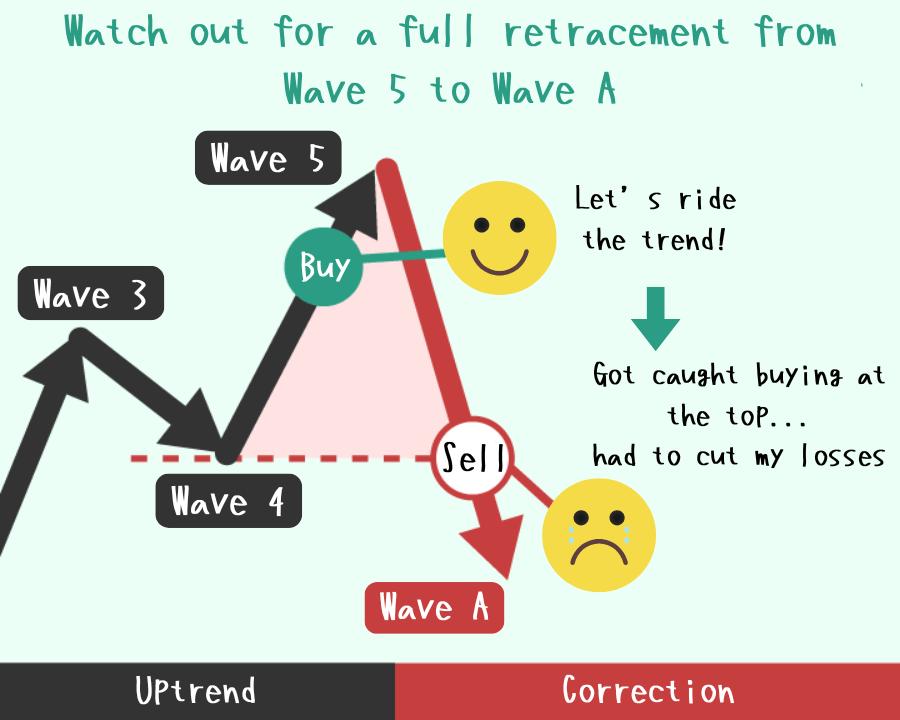
As a result, the price often drops back near the starting point of Wave 5—or even below it—leading to what’s known as a “full retracement” or a “round trip” move.
Just when you’re thinking of jumping on the trend, you get hit with a full retracement and end up stopping out—classic move.
It’s easy to get caught buying the top or selling the bottom, so recognizing the end of Wave 5—right where Wave A begins—is crucial!
Wave B: The Deceptive Wave
In Elliott Wave Theory, Wave B is often referred to as a “deceptive wave” that moves in the direction of the previous trend.
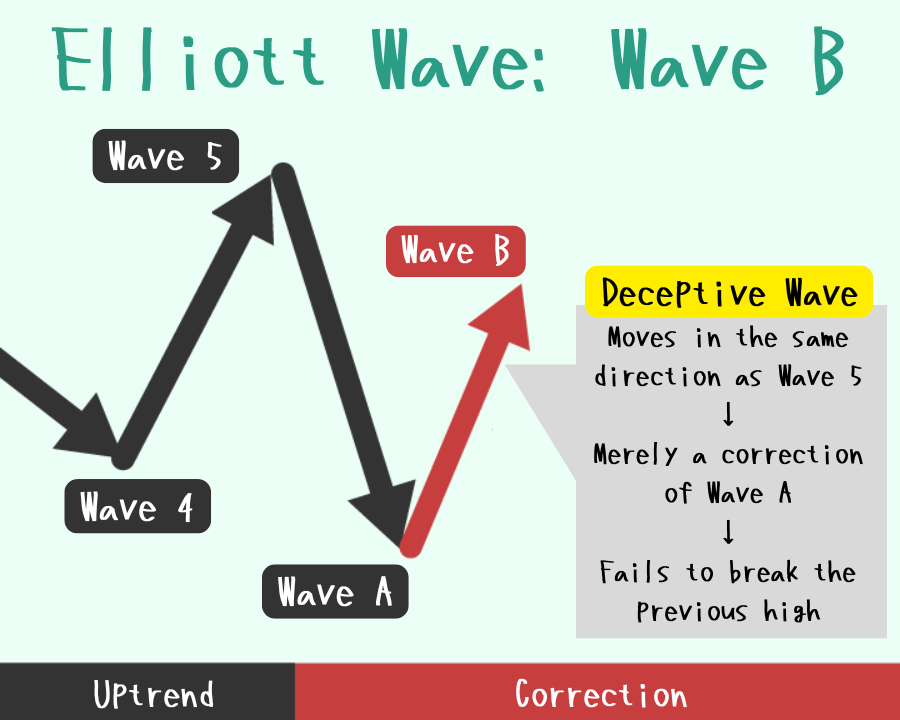
Wave B moves in the same direction as the previous uptrend formed by Waves 1 through 5, but it is actually just a corrective move against Wave A’s decline.
This makes it a misleading wave that often creates confusion among market participants.
During Wave B, optimism toward the previous trend tends to resurface, leading many traders to believe the original trend is resuming.
AThe trend must still be continuing after all.
BLet’s follow the trend and keep aiming for higher highs!
CIt looks like a trend reversal might be happening, but I’m starting to get confused.
However, in most cases, Wave B fails to surpass the new high reached at Wave 5 and transitions into the next Wave C, which is a decline.
From both fundamental and technical perspectives, it is common to encounter situations where traders feel they “don’t understand why the price is rising” or “the analysis doesn’t seem to add up.”
If you entered a buy position during Wave A, failing to close it out during Wave B could result in significant losses in the upcoming Wave C.
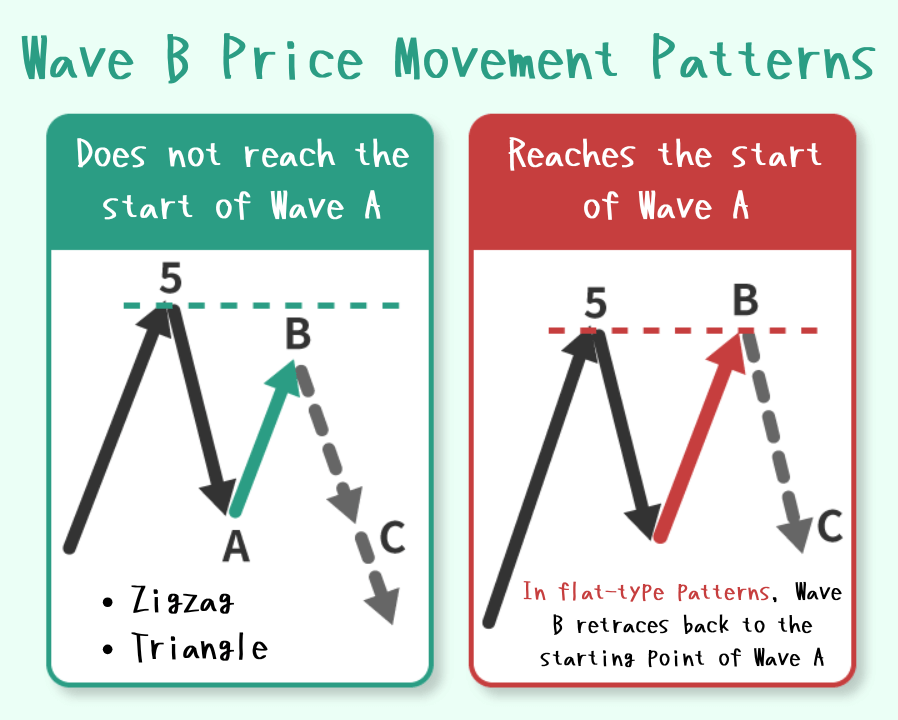
As an exception, when waves A through C form a “flat” pattern, Wave B can reach all the way to the end of Wave 5.
It may even push the price slightly beyond that high, so caution is necessary.
Wave C: The Wave That Breaks the Previous 1–5 Trend
In Elliott Wave Theory, Wave C is called the “wave that breaks the previous trend.”
It is characterized by a strong price movement in the opposite direction of the trend formed by Waves 1 through 5.
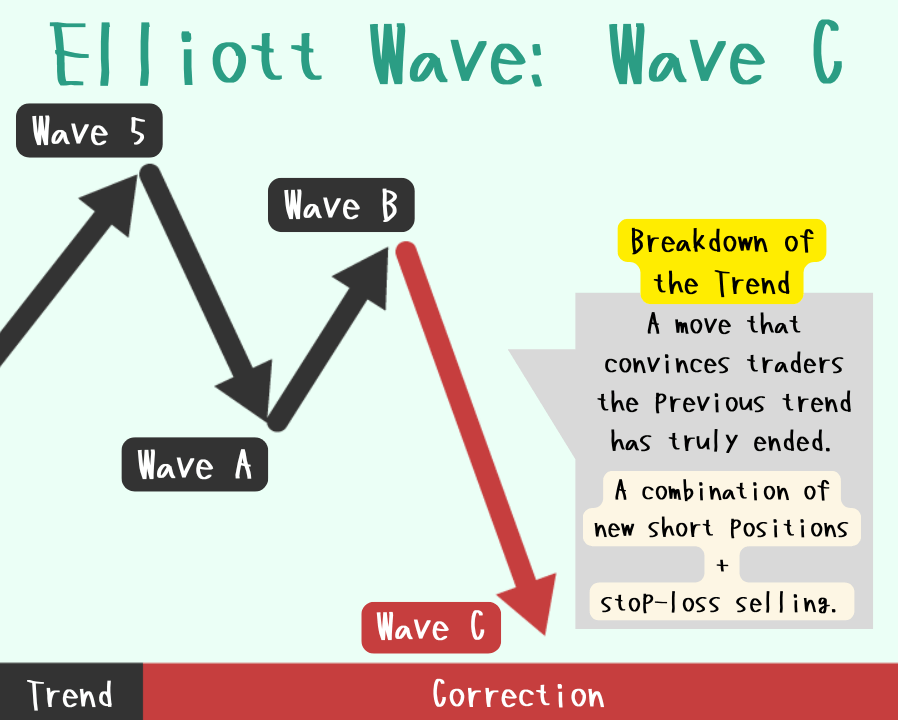
If Wave B fails to surpass the high of Wave 5, or if the upward movement is weak, selling pressure increases as participants begin taking profits.
This, combined with new selling, triggers the start of Wave C’s decline.
In terms of market sentiment, participants tend to split into two groups:
Those who become convinced that the trend has ended.
And those who are forced to cut their losses.
AThe trend had already reversed with that previous drop in Wave A!
BLooks like the trend really was over… Time to cut my losses.
CMy unrealized losses keep growing. It’s too late to exit now…
The reason why Wave C often brings such a strong move—enough to make many believe a full trend reversal has occurred—can be explained as follows:
- A clear negative fundamental shift emerges against the previous trend (Waves 1–5).
- A cascade of stop-losses and forced liquidations occurs from traders who got caught during Wave B.
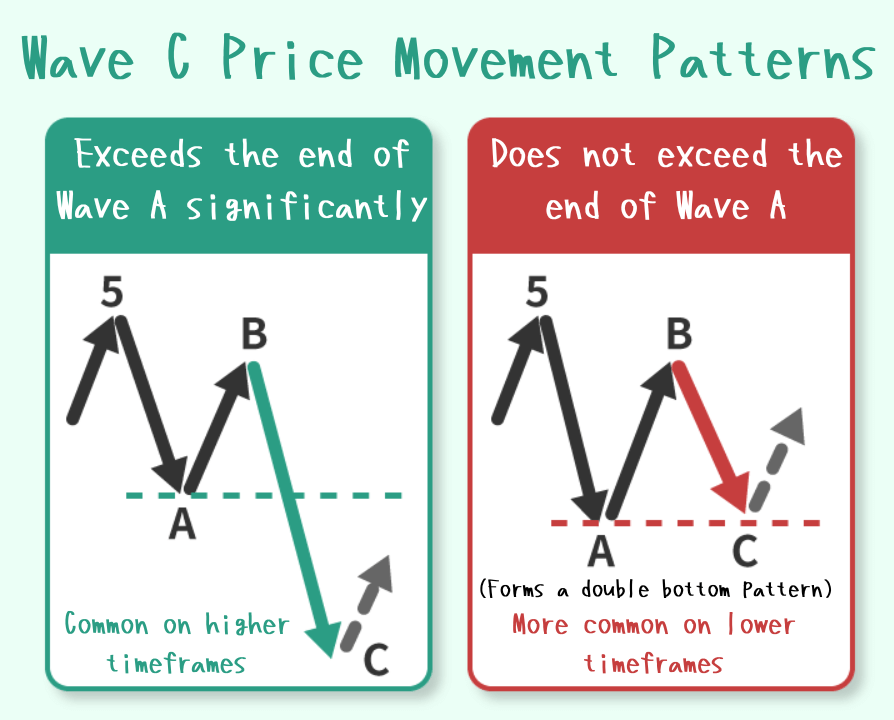
Especially on higher timeframes—such as the monthly or daily chart—Wave C tends to produce a significant decline.
On the other hand, on shorter timeframes like the 5-minute or 15-minute chart, Wave C often fails to break below the end of Wave A, resulting in what’s known as a “failure.”
This is likely because, from the perspective of the larger trend on higher timeframes, Wave C is merely a corrective move.
If you stubbornly hold on without cutting losses during Wave C, you might end up getting forcibly liquidated.
That’s right. It depends on how you manage your capital, but the risk of forced liquidation is high. The chances of that position recovering quickly are low—and even if it does recover, it could take a long time!
Summary
This overview introduced the likely market psychology of participants during the “5-wave impulse and 3-wave correction” structure in Elliott Wave Theory.
It covered the sentiment behind Waves 1 through 5, as well as Waves A through C, highlighting how traders typically think and behave at each stage.
- Wave 1: “The Beginning Wave”
— The trend is actually reversing, though it’s not yet widely recognized. - Wave 2: “The Price Correction Wave”
— A significant pullback against Wave 1, often shaking out early entrants. - Wave 3: “The Powerful Impulse Wave”
— The strongest move in the trend direction, with broad participation. - Wave 4: “The Time Correction Wave”
— Often forms a sideways range; a pause before the final push. - Wave 5: “The Final Wave”
— Marks the last move of the trend that began with Wave 1. - Wave A: “The Reversal Wave”
— Starts a major correction against the 1–5 trend, signaling potential trend change. - Wave B: “The Deceptive Wave”
— Can appear as a continuation of the 1–5 trend, but often misleads traders. - Wave C: “The Trend-Breaking Wave”
— Strongly moves against the prior trend, invalidating Wave B and confirming reversal.
That wraps up the summary of each wave count and its typical characteristics.
If You Want to Learn Elliott Wave Theory, This Book Is Recommended!
Needless to say, when you fail to predict any big movements of the market, trading is more or less a gamble, and things become much more dangerous.
This book would save you from those unexpected situations, and pave the way for consistent profits.
Elliott Waves Made Simple: Master Elliott Waves Techniques In Less Than 48 Hours