The Elliott Wave Theory includes five basic wave patterns, one of which is the motive wave called the Diagonal.
Similarly, the Impulse is also a type of motive wave, but it differs from the Diagonal in how the price moves.


The Impulse wave is like a wave that moves forward confidently without hesitation, while the Diagonal is more like a wave that moves forward but with some hesitation or uncertainty.

It moves in the trend direction, but if you’re trading with the trend, it can feel a bit frustrating or choppy.
The Diagonal wave often appears at the beginning or end of a trend, and spotting it can help you quickly anticipate trend reversals or new trend starts.
In this article, we will explain the characteristics and types of Diagonal waves!
I use “XMTRADING” as my trading tool.

It is my personal most trusted trading account and is used by many professional traders.
I use “TradingView” as my analysis tool.
Registering an account gives you access to many features for free.
What Is Elliott Wave Theory?
Elliott Wave Theory is the idea that markets move in repeating, cyclical patterns that reflect the collective psychology of human behavior.
According to this theory, price movements are not random—they follow identifiable wave patterns driven by crowd sentiment.
The theory is built on three core principles:
- Markets advance in 5-wave patterns and correct in 3-wave patterns
— Price trends unfold in a five-wave structure, followed by a three-wave correction. - Markets have a fractal structure
— Wave patterns repeat at different scales, from minutes to years, with the same structure. - Market patterns can be categorized into five basic wave types
— All wave movements fit into one of five fundamental forms.
For more details on Elliott Wave Theory itself, be sure to check out the article below!

Elliott Waves Made Simple: Master Elliott Waves Techniques In Less Than 48 Hours
Three Characteristics of the Diagonal
The Diagonal is a type of motive wave that moves in the direction of the trend, but unlike the Impulse, it doesn’t move strongly and steadily forward.
Instead, it tends to progress with significant ups and downs along the way.
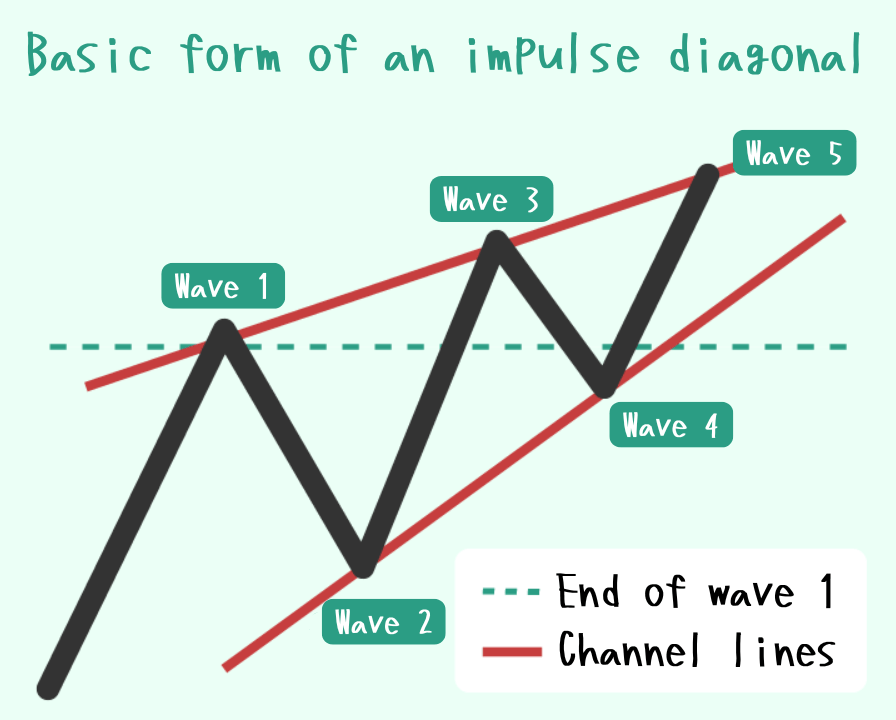
To identify a wave as a Diagonal, you need to focus on three key characteristics.
- Wave 4 overlaps the end price of Wave 1.
- The wave sizes generally follow the order: Wave 1 > Wave 3 > Wave 5.
- The upper and lower channel lines converge (form a narrowing wedge).
If these three characteristics fit, does that mean it might be a Diagonal?
Yes, exactly! But keep in mind it’s only a possibility.
Features 2 and 3 aren’t absolute rules, so be careful.
I’ll explain the exceptions in the Diagonal section.
Got it! So we’re talking about the basic type of Diagonal here.
When analyzing and forecasting motive waves, these characteristics serve as key criteria to distinguish between an Impulse and a Diagonal.
Additionally, there are two common sub-wave patterns: the 5-3-5-3-5 pattern and the 3-3-3-3-3 pattern.
Understanding these patterns allows you to interpret price movements in greater detail.
I’ll explain the 5-3-5-3-5 and 3-3-3-3-3 patterns in detail later!
For now, let’s focus on understanding the three basic characteristics first.
Characteristic ① Wave 4 overlaps the end price of Wave 1
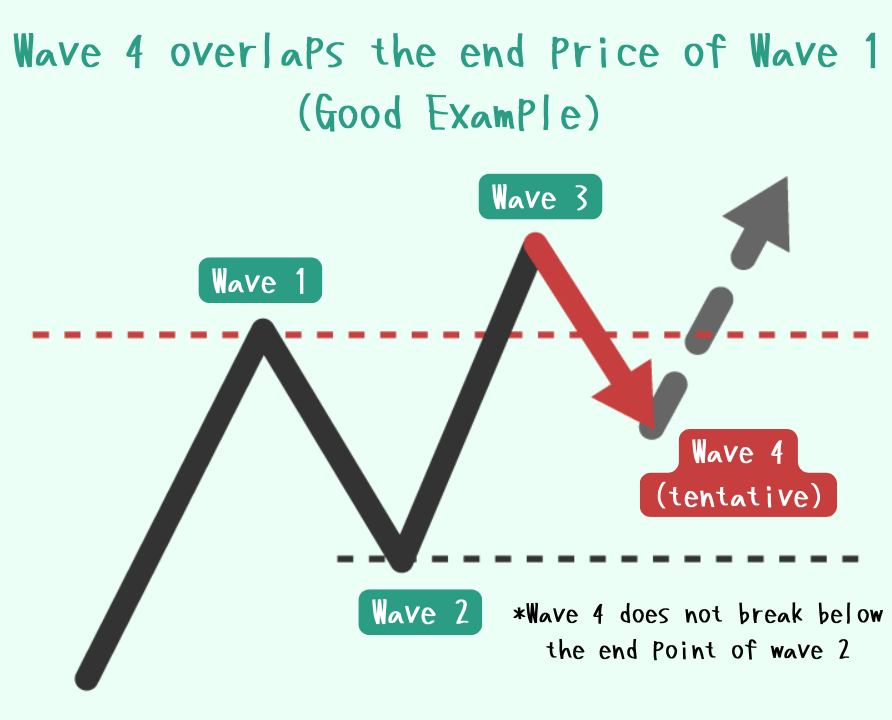
Motive waves complete the first three waves before the fourth wave forms.
In a Diagonal, the fourth wave tends to overlap and move beyond the end point of the first wave.
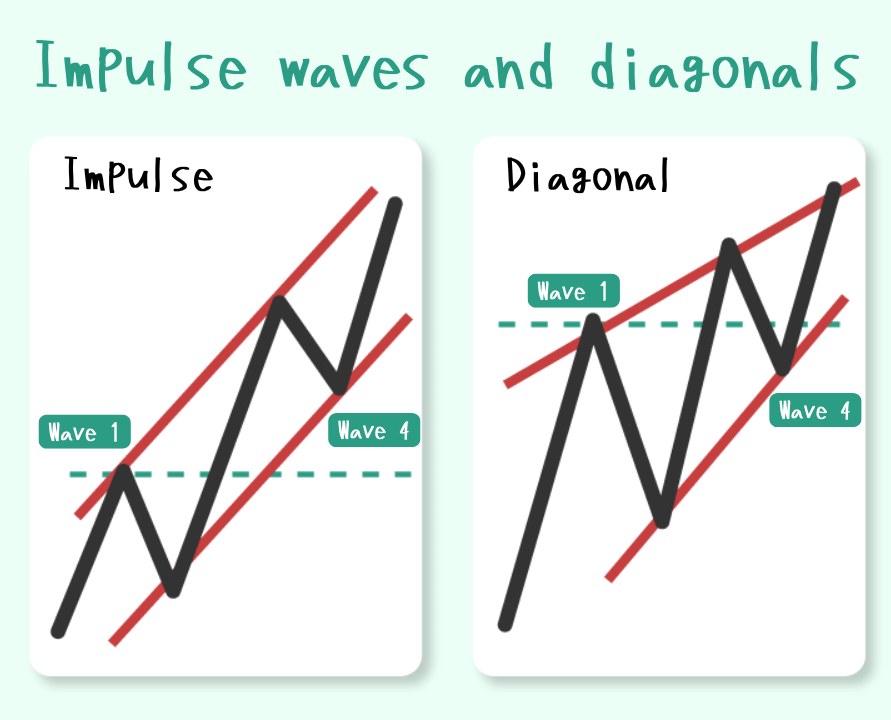
In contrast, the Impulse strictly requires that the fourth wave does not overlap the end of the first wave. This rule does not apply to the Diagonal.
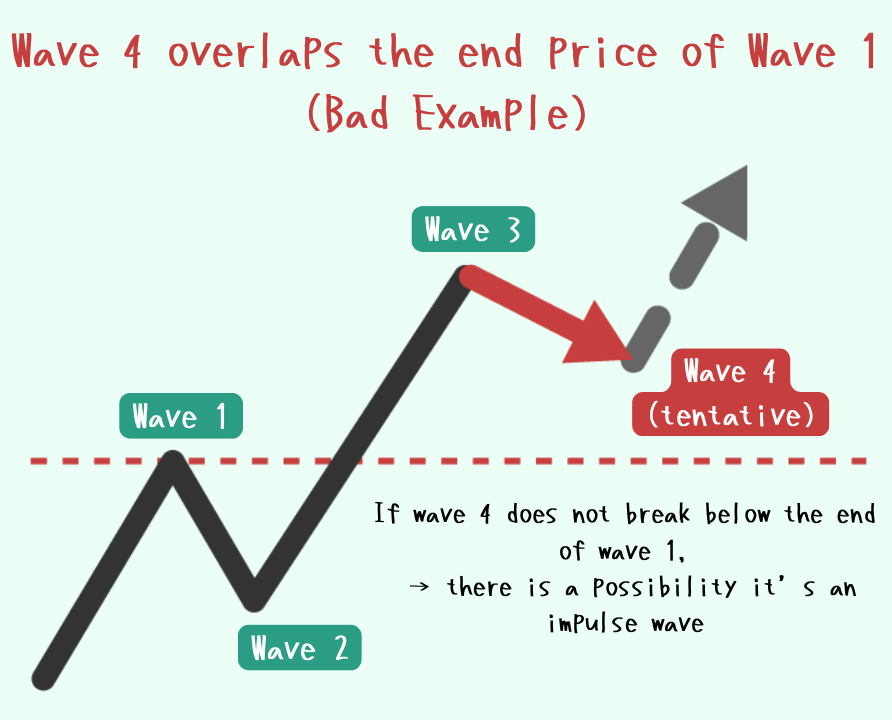
So, we can distinguish between an Impulse and a Diagonal based on Characteristic ①!
Exactly!
When you expect an Impulse but see that Wave 4 moves beyond the end of Wave 1, it’s time to consider the possibility of a Diagonal.
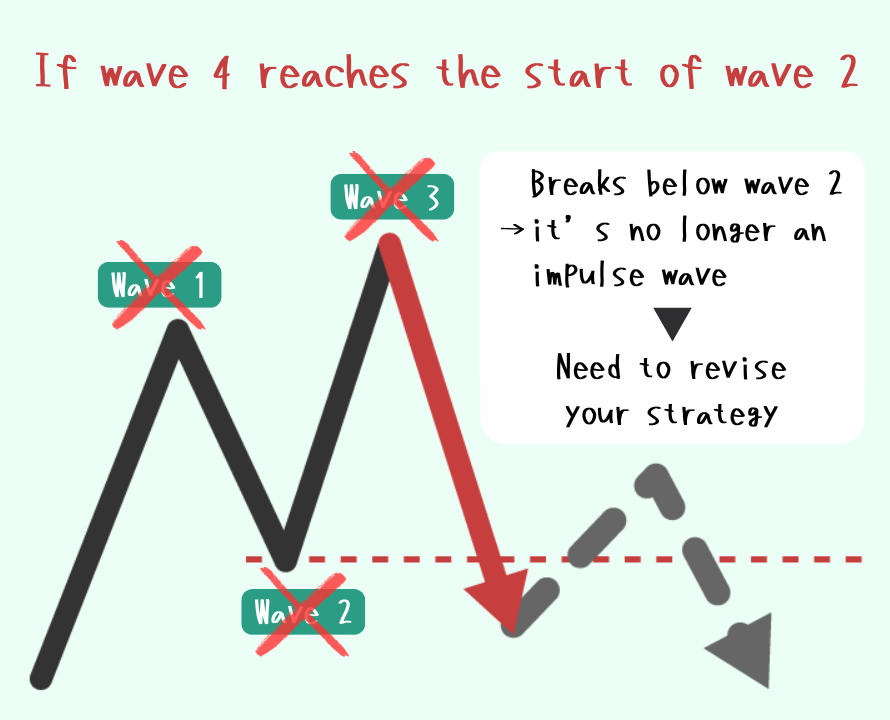
Also, if the wave assumed to be Wave 4 falls below the start of Wave 2, then it is neither an Impulse nor a Diagonal.
This likely indicates the price is moving within a corrective wave, so you should reconsider your wave count and trading strategy accordingly.
Characteristic ② The wave sizes generally follow the order: Wave 1 > Wave 3 > Wave 5
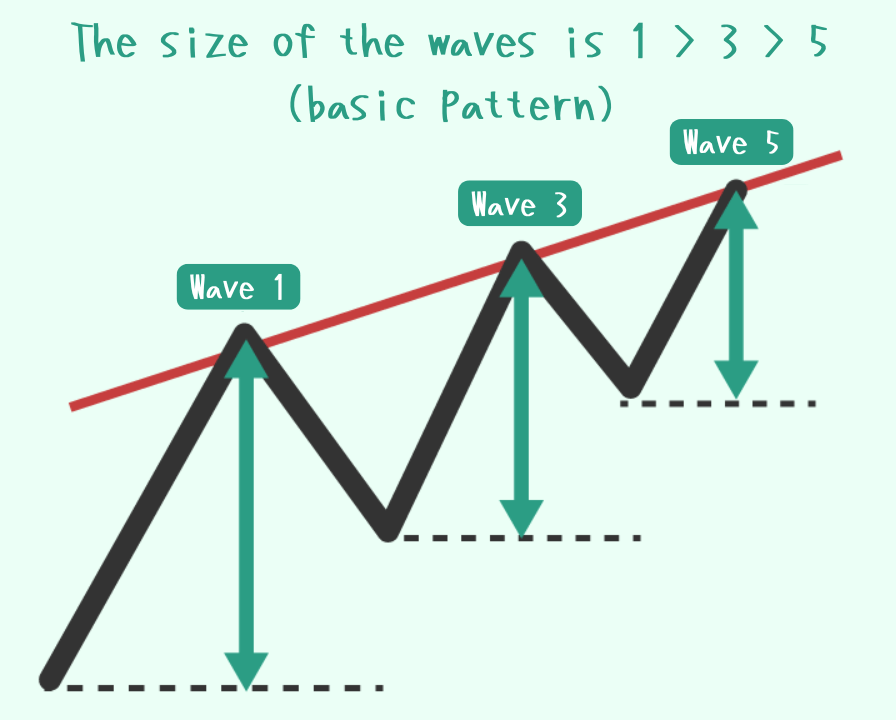
The Diagonal typically follows a wave size pattern where Wave 1 > Wave 3 > Wave 5, with each successive wave generally having a smaller price range.
This is a fundamental characteristic of the Diagonal. Although there are exceptions, most cases follow this pattern.
Additionally, the end of Wave 5 usually aligns near the upper or lower channel line, serving as a useful reference point.
So basically, the price movement tends to taper off over time.
That’s right. The typical Diagonal shows a gradual weakening of price momentum.
But remember, nothing is absolute in the market, so we also need to consider exceptions like the ones I’ll explain next!
Regarding the 5th wave of a Diagonal, there are also two possible price movement scenarios to consider:
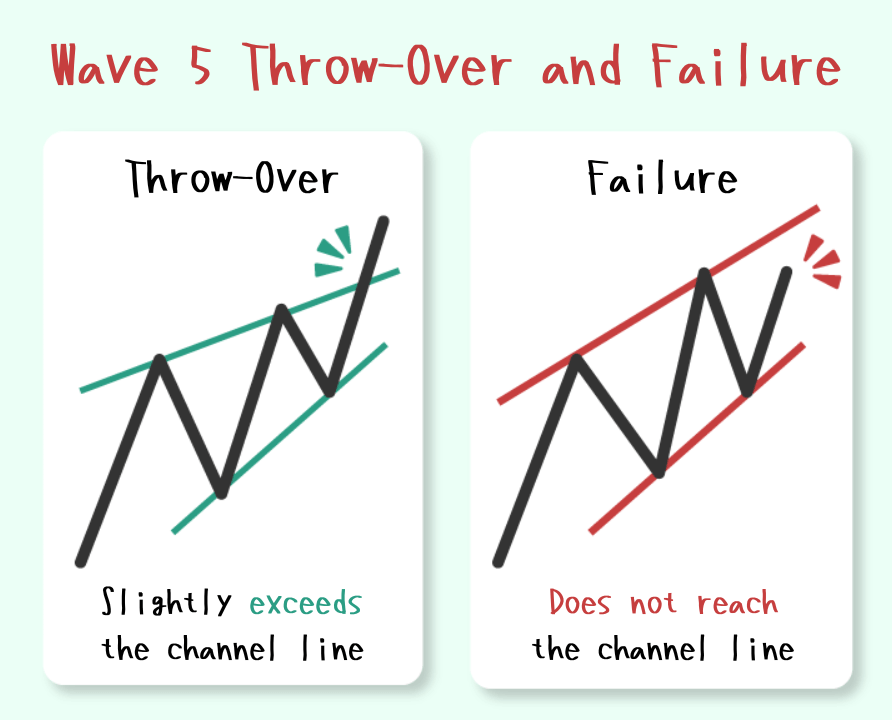
- Throw-over (Slow Over): The 5th wave extends beyond the channel line, with wave sizes typically following the order Wave 1 > Wave 5 > Wave 3.
- Failure (Fail): The 5th wave does not reach the channel line and fails to exceed the end of the 3rd wave.
How far the 5th wave extends is influenced by factors such as the presence of stop-loss orders, market overheating, and overall market conditions (fundamentals).
Characteristic ③ The upper and lower channel lines converge (form a narrowing wedge)
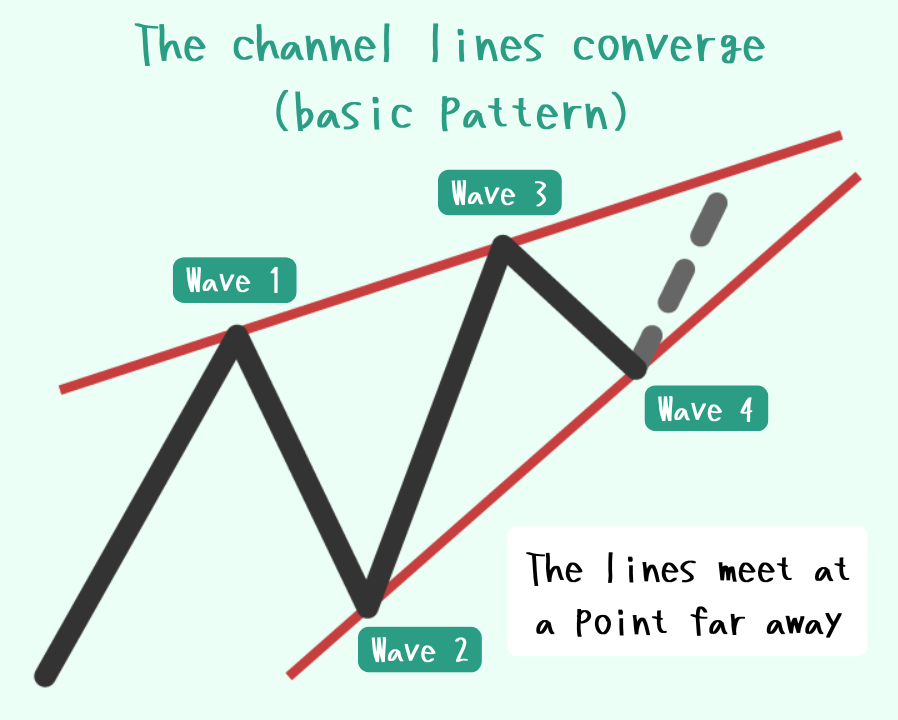
In a Diagonal, the channel lines connecting the endpoints of Waves 1 and 3, and those connecting Waves 2 and 4, gradually move closer together and eventually converge.
This phenomenon is called convergence, where the two lines approach each other and intersect at a distant point.
These converging channel lines serve as a reference for where Wave 5 is likely to end, though the exact position depends on the previously mentioned characteristics and the current market conditions.
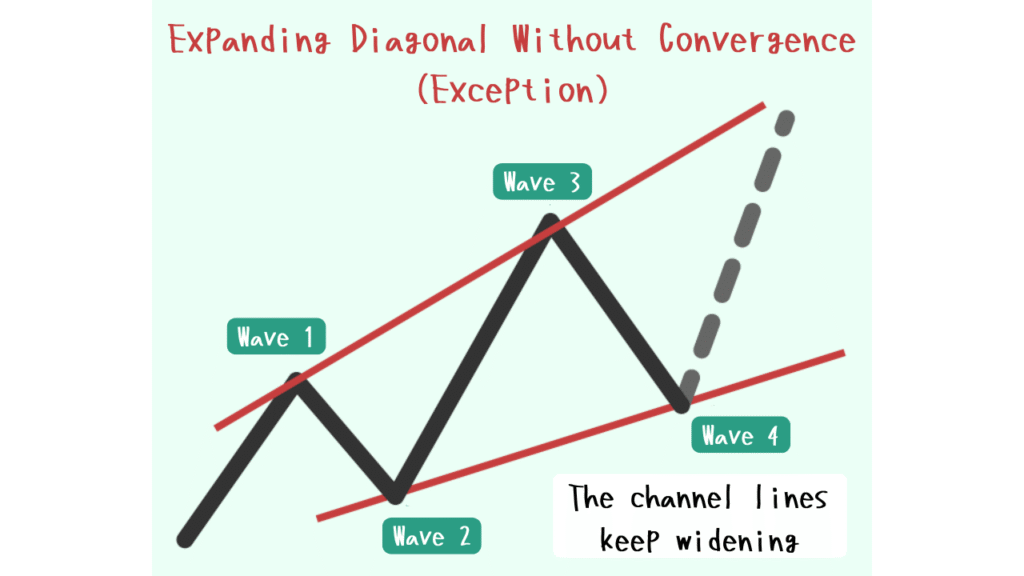
However, not all Diagonals converge—there is a special case called the Expanding Diagonal.
‘Expanding’ means the channel lines spread apart, right?
Yes, exactly! I’ll explain the Expanding Diagonal in detail later.
Where Diagonals Typically Appear
Diagonals often show up in specific positions within the wave structure.
Motive Waves: 1st and 5th Waves of Impulse and Diagonal
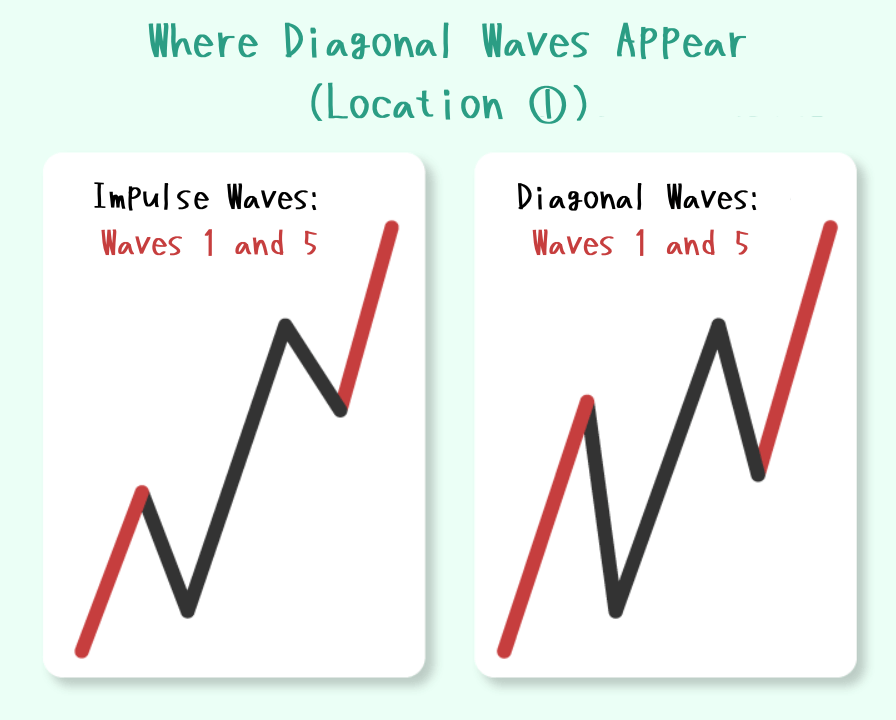
They tend to appear most often as the 1st and 5th waves of motive waves (Impulse and Diagonal) on higher timeframes.
Corrective Waves: A and C Waves of Zigzag, and C Wave of Flat
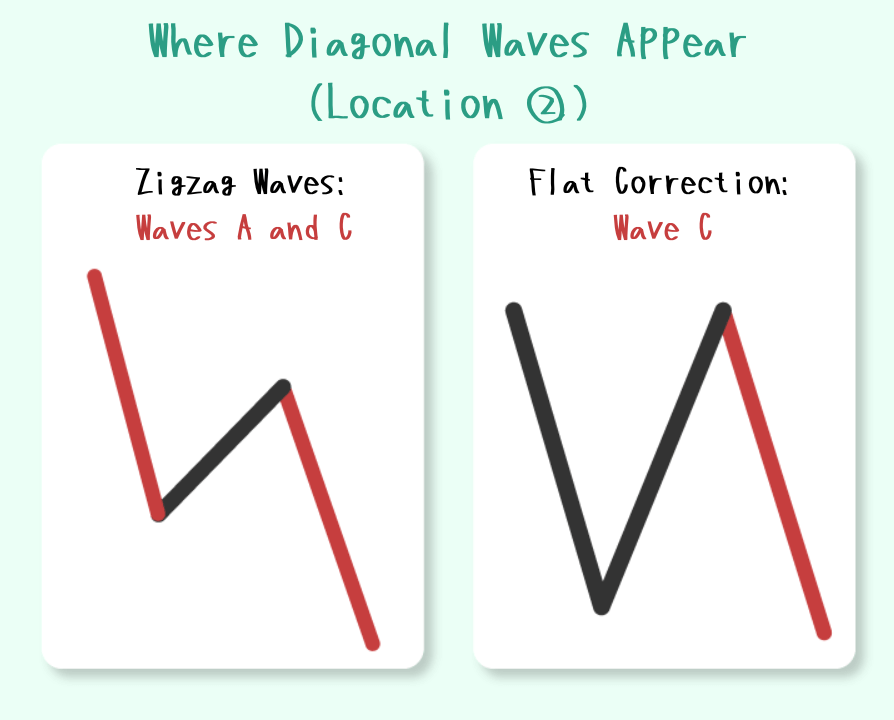
They also frequently appear as the A and C waves of corrective Zigzag patterns and the C wave of Flat corrections on higher timeframes.
Two Types of Diagonals and Their Subwave Structures
Depending on where they appear, Diagonals are classified into two types.
When a Diagonal appears as the 1st wave or A wave, it is called a Leading Diagonal.
When it appears as the 5th wave or C wave, it is called an Ending Diagonal.
These two types are related to the “5-3-5-3-5” and “3-3-3-3-3” subwave patterns mentioned earlier in Characteristic ①!
Beginning of a Trend: Leading Diagonal
When one trend ends and a new trend begins, the first wave of the new trend—Wave 1 or Wave A—often appears as a Leading Diagonal.
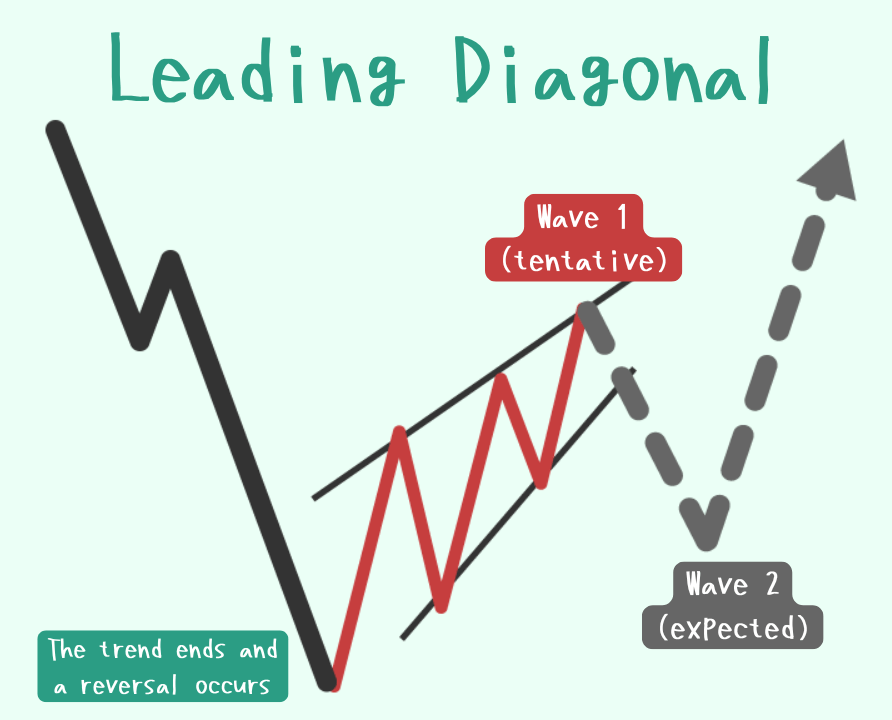
For example, if you see an upward Diagonal after a major downtrend, it may signal the beginning of a new uptrend.
If the following 2nd wave does not break below the starting point of Wave 1, it suggests that an uptrend may continue to unfold through Waves 3 to 5.
If you enter a position around the end of Wave 2 or the start of Wave 3, you could trade with high expected value!
Exactly. It becomes a key reference point when applying classic strategies like “buying the dip” or “selling the rally.”
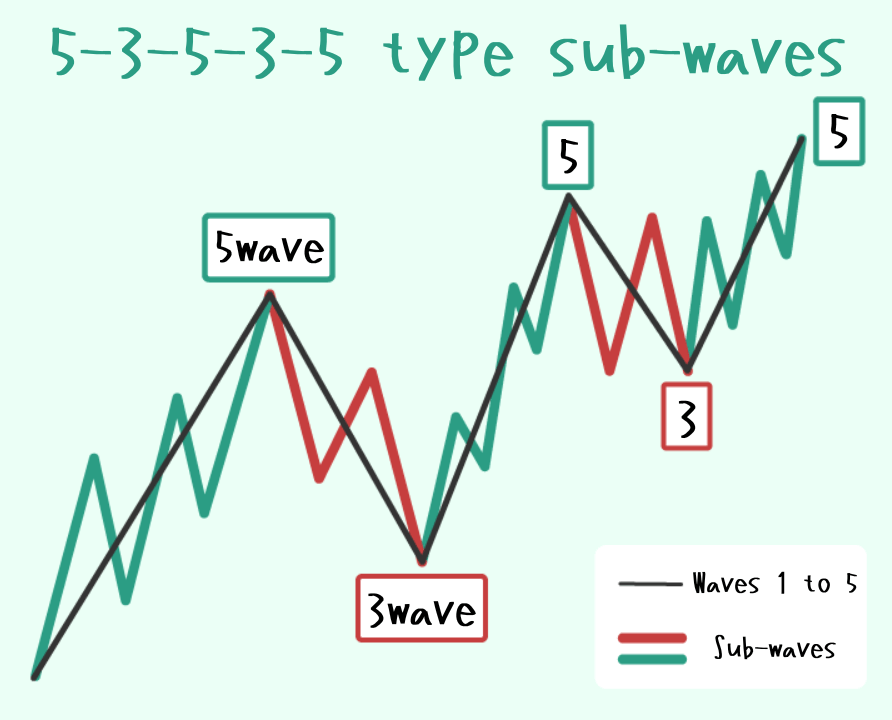
The subwaves of a Leading Diagonal alternate between 5-wave and 3-wave structures, forming a 5-3-5-3-5 pattern. That’s why it’s also called a “5-3-5-3-5 type.”
End of a Trend: Ending Diagonal
When a trend is nearing its conclusion, the final 5th wave or C wave often appears as an Ending Diagonal.
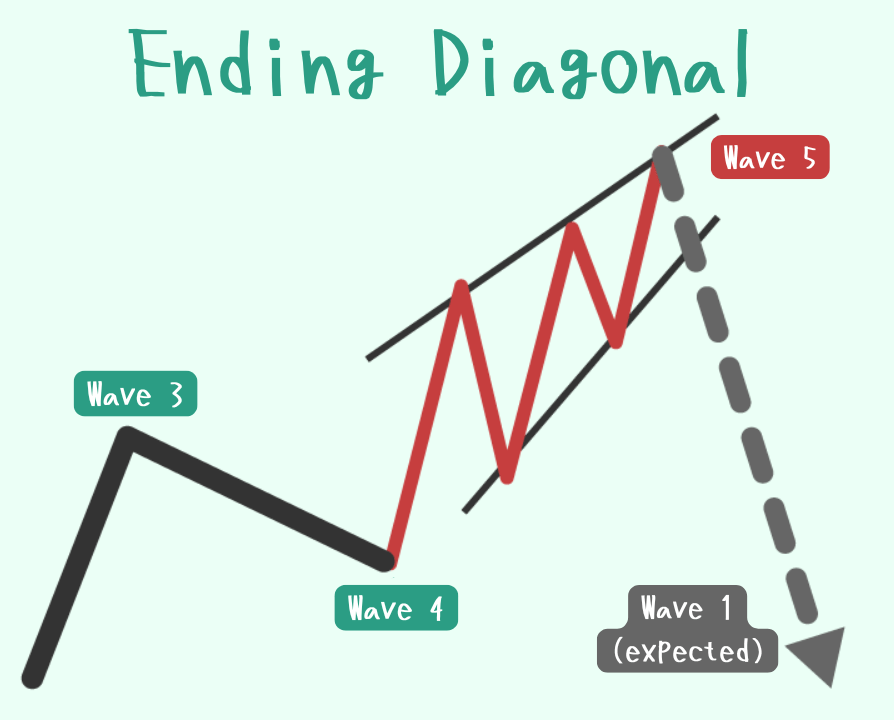
For example, in a market that has been in an uptrend, if a recently formed wave appears as a Diagonal made up of three-wave structures, it may suggest that the uptrend is coming to an end.
The reason for this uncertain, back-and-forth movement is that the momentum behind the trend is weakening.
Once an Ending Diagonal is complete, the market often moves sharply in the opposite direction of the preceding trend.
If you spot price action that looks like an Ending Diagonal, trend-following strategies might be risky.
Right. It depends on the larger timeframe context, but it can definitely be a helpful signal when considering a counter-trend strategy.
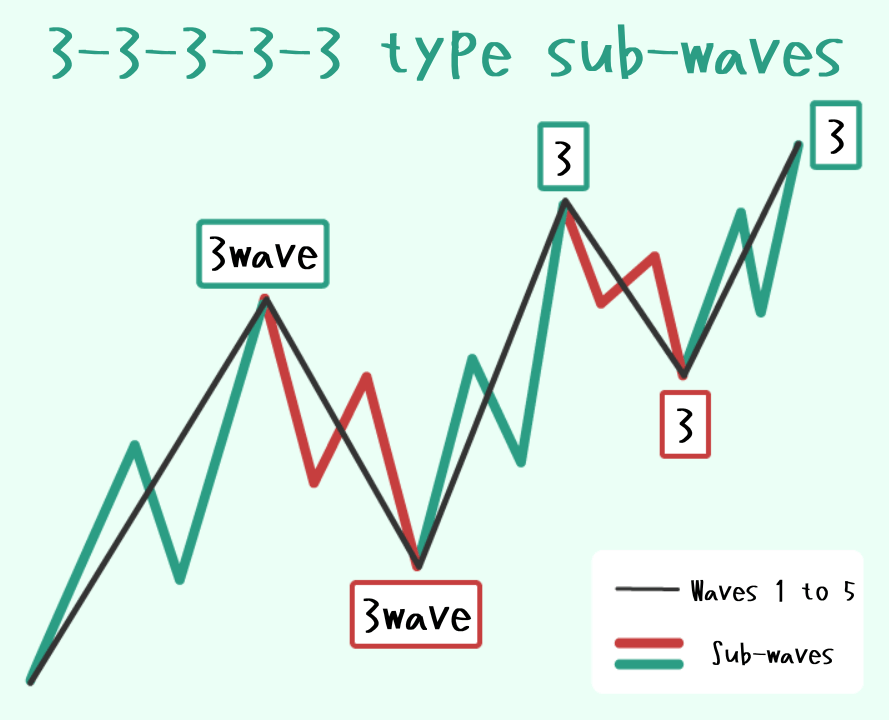
Also, the subwaves of an Ending Diagonal each consist of three-wave structures, forming what’s known as the 3-3-3-3-3 pattern. That’s why it’s also referred to as the “3-3-3-3-3 type.”
Exception: Expanding Diagonal
I’d like to finish by talking about the “expanding diagonal,” where the channel lines do not converge.
There is a special type of diagonal called the “expanding diagonal.”
If the following two characteristics are observed, the wave pattern is likely an expanding diagonal.
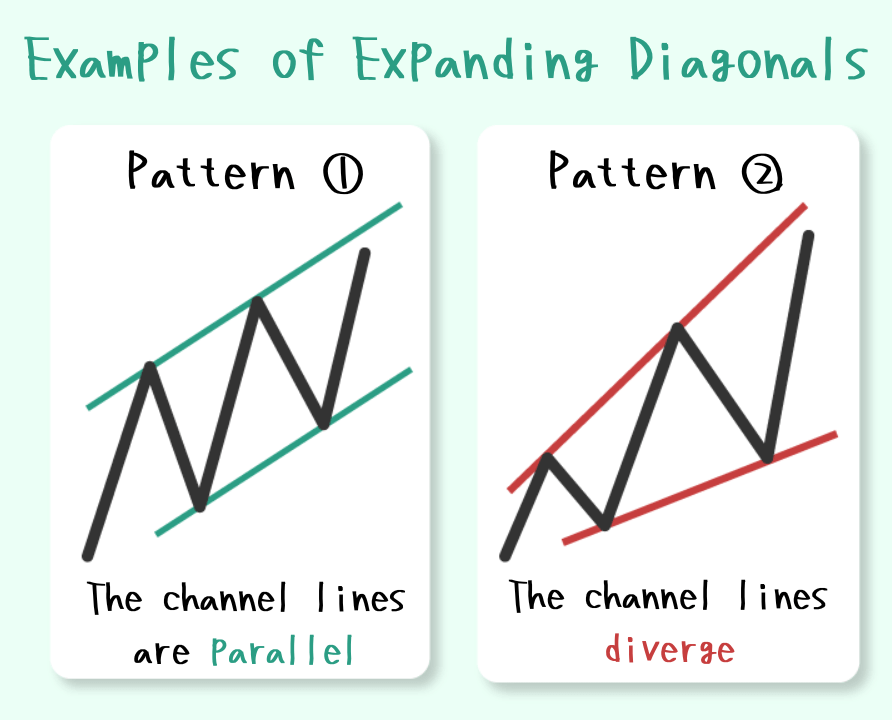
- The channel lines that indicate the upper and lower price limits do not converge but extend in parallel.
- The first wave has the smallest range, while waves 3 and 5 are larger (either wave 1 < wave 3 < wave 5 or wave 1 < wave 5 < wave 3).
Especially when the channel lines are diverging, the price movements tend to become increasingly volatile in the order of wave 1 → wave 3 → wave 5.
This is considered an exception, so it’s probably impossible to predict or trade with the expectation that this pattern will appear in advance.
That’s right. It’s more common to realize after analyzing a completed chart that “Oh, it was an expanding diagonal.”
It’s best to keep it in the back of your mind, and when you see price movements with widening channel lines, be alert to the possibility that it might be an expanding diagonal.
Summary
Here’s a brief summary to finish.
First, the “diagonal” has three basic characteristics.
- Wave 4 overlaps the end price of Wave 1.
- The wave sizes generally follow the order: Wave 1 > Wave 3 > Wave 5.
- The upper and lower channel lines converge (form a narrowing wedge).
Characteristics 2 and 3 are not absolute requirements.
Also, “diagonals” can be classified into three main types.
- Leading Diagonal
ーAppears at the beginning of a trend with a 5-3-5-3-5 pattern - Ending Diagonal
ーAppears at the end of a trend with a 3-3-3-3-3 pattern - Expanding Diagonal
ーChannel lines do not converge, and price movements are volatile
By learning these together with the impulse waves, you can better understand trend phases and help predict price ranges.
If You Want to Learn Elliott Wave Theory, This Book Is Recommended!
Needless to say, when you fail to predict any big movements of the market, trading is more or less a gamble, and things become much more dangerous.
This book would save you from those unexpected situations, and pave the way for consistent profits.

Elliott Waves Made Simple: Master Elliott Waves Techniques In Less Than 48 Hours