
USDJPY Market Analysis and Trading Strategies.
*Personal Opinion
I use “XMTRADING” as my trading tool.

It is my personal most trusted trading account and is used by many professional traders.
I use “TradingView” as my analysis tool.
Registering an account gives you access to many features for free.
Waveforms of each time leg
Weekly
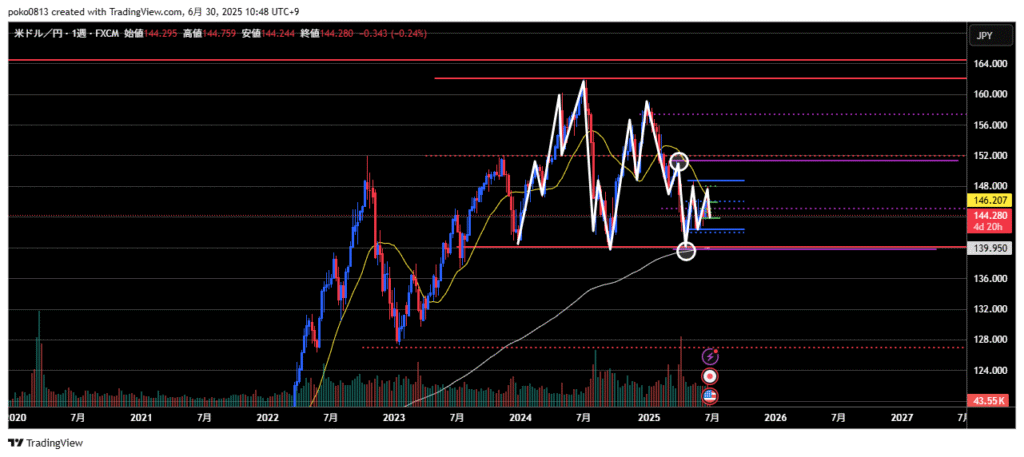
Downtrend.
The fifth wave of the Elliott Wave downtrend may have ended, signaling a possible reversal, or the fourth wave correction may still be ongoing, with the fifth wave yet to begin.
The weekly chart makes it difficult to grasp the overall direction.
Daily
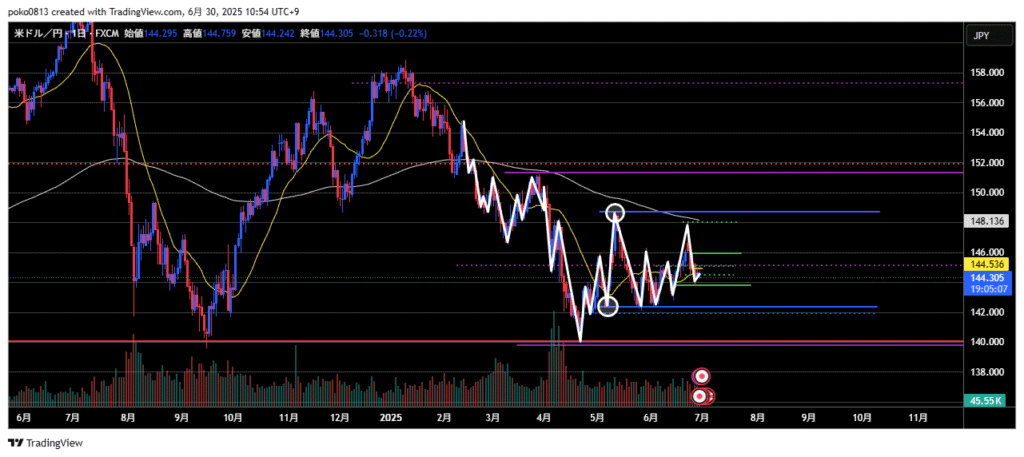
From a bullish perspective, a range has formed between ¥142.3 and ¥148.5.
Although the price once climbed near the top of the range, it was sharply pushed back by a candlestick wick.
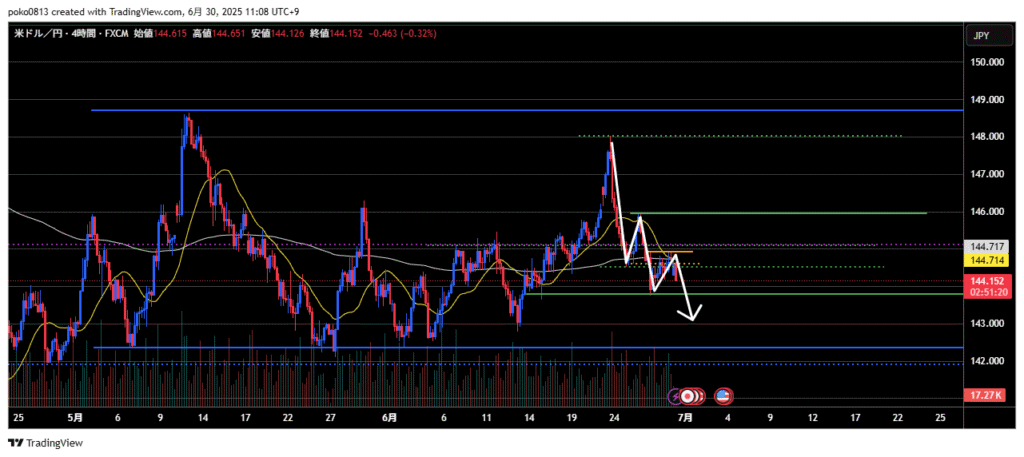
4-Hour
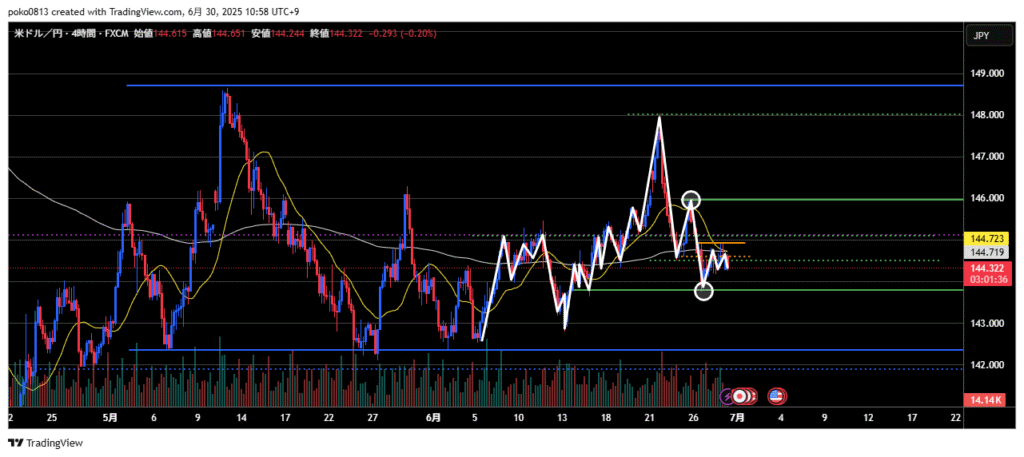
The last swing low of the uptrend was broken, and lower highs and lower lows are forming, signaling the start of a downtrend.
It’s unclear whether the third wave of the downtrend has ended and a correction is underway, or if the third wave is still in progress.
It remains to be seen whether the 200 EMA, 21 SMA, and other indicators will act as resistance.
1-Hour
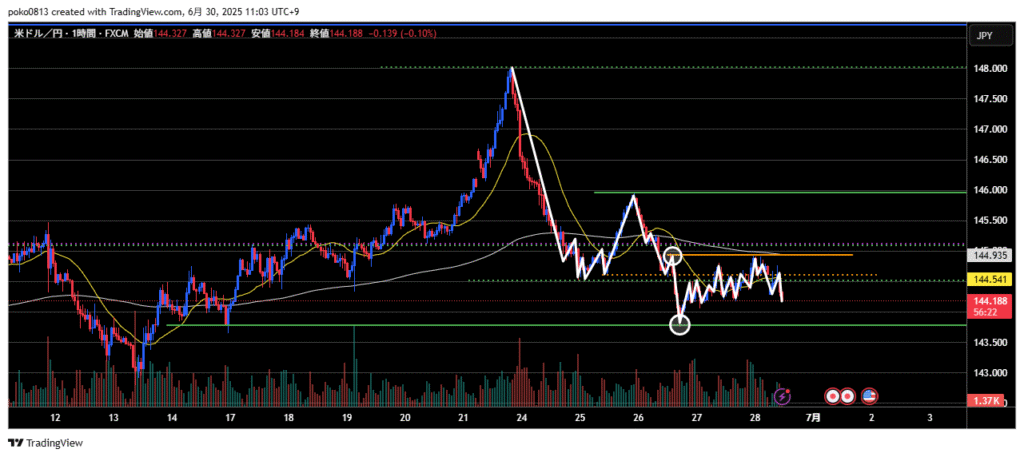
Downtrend.
A range has formed within the price swing of the last move, with significant consolidation seen on the lower timeframes.
Trade Strategies
Using the 4-hour chart as the reference timeframe, selling on pullbacks remains the primary strategy.
The week began with a gap, making trading conditions slightly tricky, but the gap has already been filled.
Since the downward momentum is strong on the lower timeframes, it would be preferable to enter after a pullback.
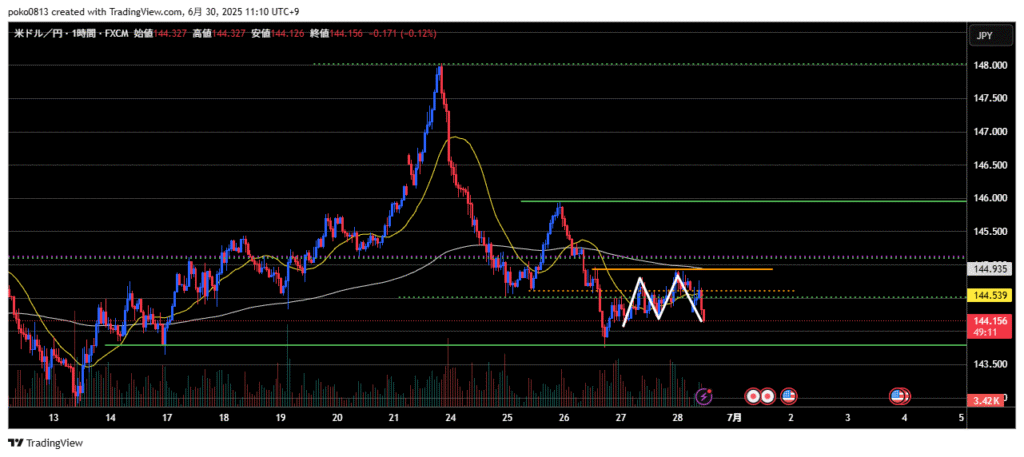
If this pattern is viewed as a double top, there’s a possibility of a temporary rebound from the current price level.
If a rebound occurs, the goal would be to sell from as high a point as possible; if the price breaks downward, a breakout entry could also be considered.
However, since a resistance zone is nearby on the 4-hour chart, there is a chance the price may return to the entry point before continuing lower.
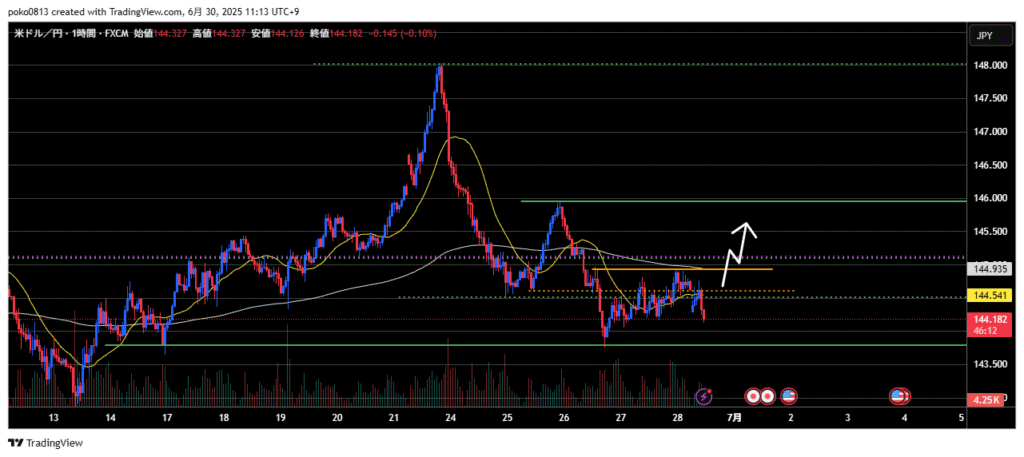
If the trend shifts upward on the 1-hour chart, it could temporarily raise expectations for a move higher, possibly reaching the previous swing high on the 4-hour chart.
A long entry may be considered if a good entry point appears on the lower timeframes.
However, since many traders are likely eyeing a pullback to sell, holding a long position for too long could be risky.