USDJPY Market Analysis and Trading Strategies.
*Personal Opinion
I use “XMTRADING” as my trading tool.

It is my personal most trusted trading account and is used by many professional traders.
I use “TradingView” as my analysis tool.
Registering an account gives you access to many features for free.
Waveforms of each time leg
Weekly
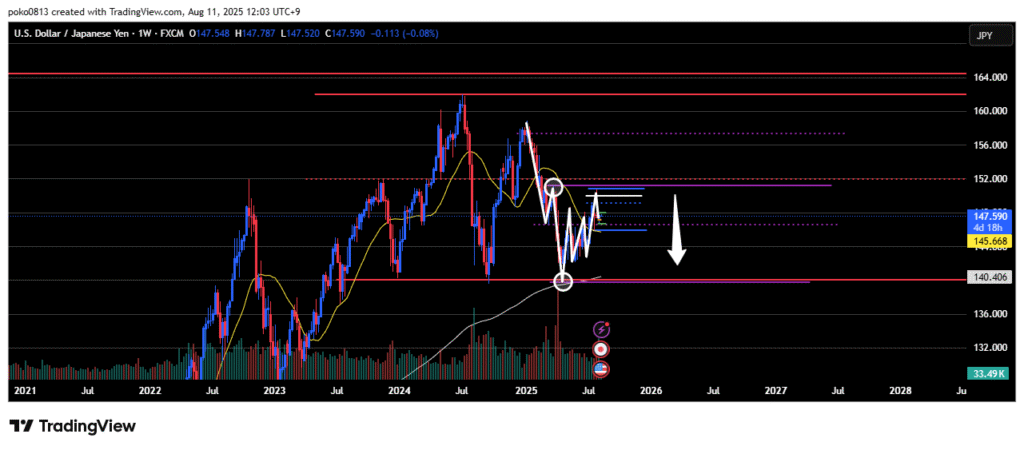
Downtrend.
The price rose to the last swing high line but bounced at that price level.
The bias remains bearish unless the last swing high line is clearly broken to the upside.
Daily
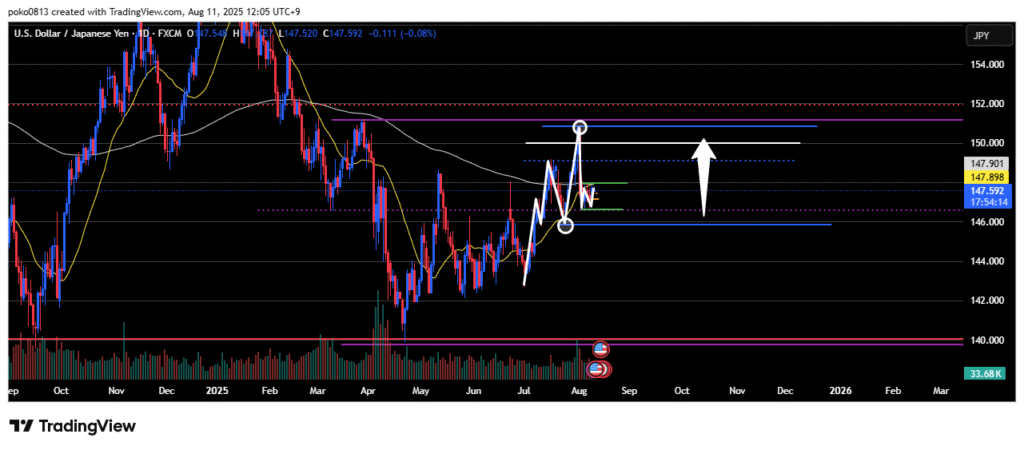
Uptrend.
The price has fallen to around the last swing low and is currently consolidating on the lower timeframes.
Alongside the results of the U.S. employment data, there was a sharp drop; however, unless the last swing low line is clearly broken to the downside, the bias remains bullish.
At present, on the daily chart, this is viewed simply as a price correction.
4-Hour
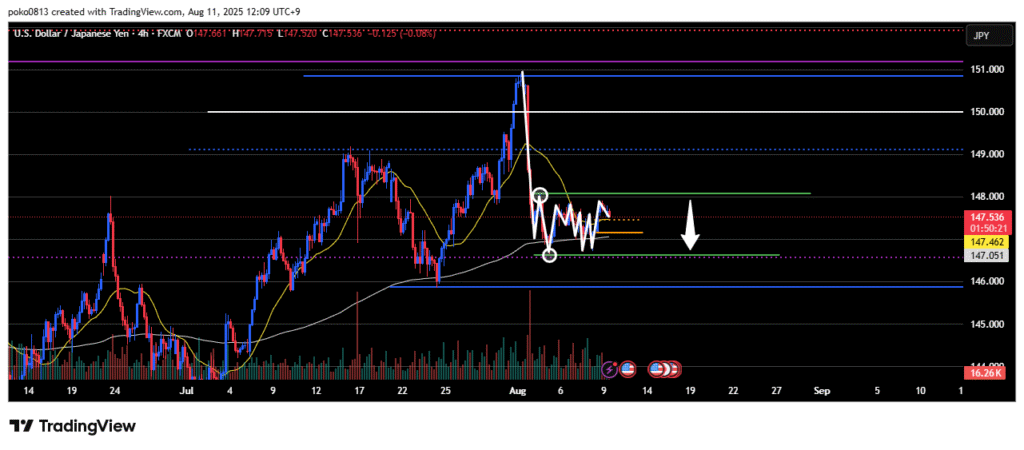
Downtrend.
A range is forming between the recent low and the last swing high.
The bias remains bearish until the last swing high line is clearly broken to the upside.
From an Elliott Wave perspective, wave 3 has not yet extended. This current range may be forming wave 2 of the downtrend, after which the price could potentially resume its decline.
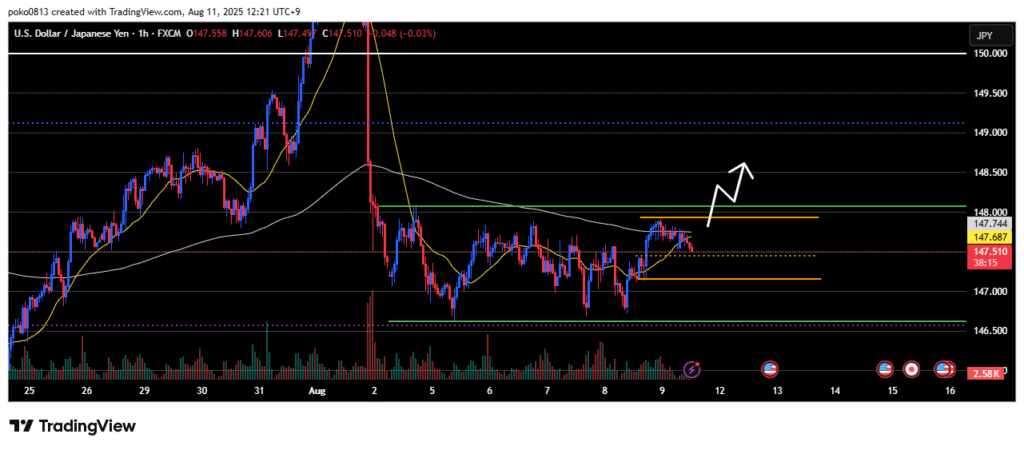
1-Hour
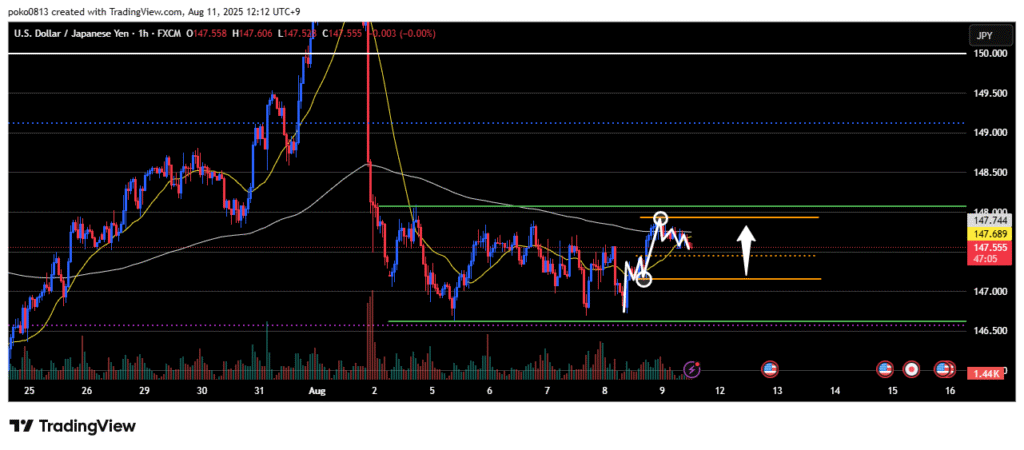
The most recent swing is in an uptrend.
However, the market bias has been shifting frequently, making it difficult to grasp a clear sense of direction.
Trade Strategies

Plan to ride the recent uptrend on the 1-hour chart by looking for short-term pullback buys.
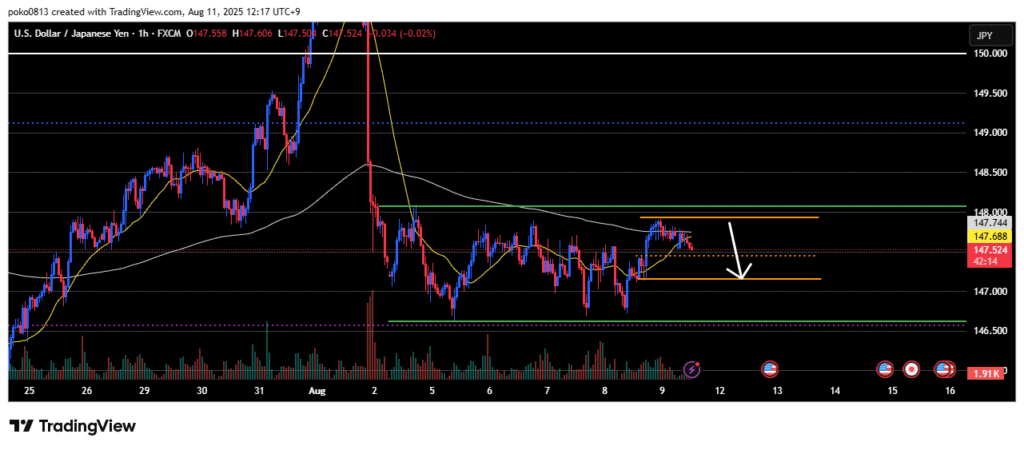
However, on the 4-hour chart, price is roughly in the middle of a range, which could reduce directional clarity.
Also, keep in mind that traders who sold from the range high might be targeting the range low, meaning selling pressure could still be significant.
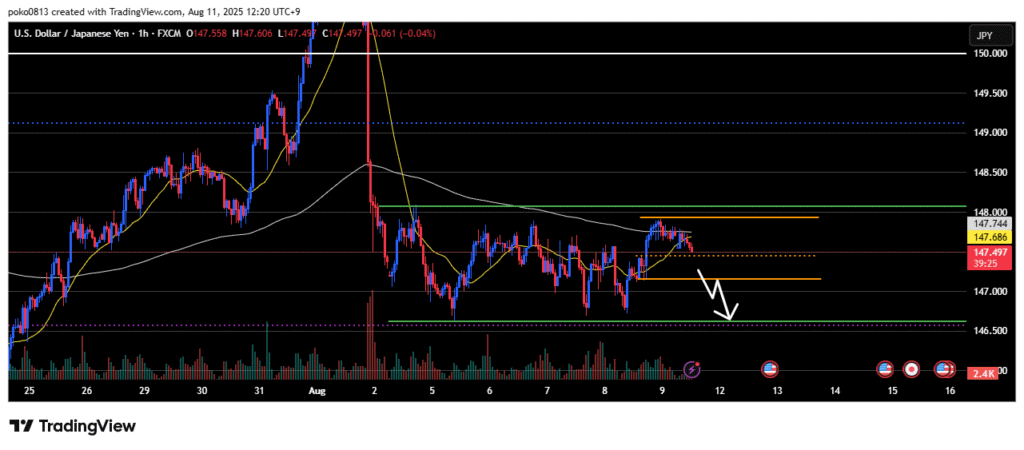
If the last swing low line on the 1-hour chart is broken to the downside, I will pass.
Considering a pullback sell near the 4-hour chart range high and the recent 1-hour chart peak.
On the 4-hour chart, the bias is bearish, and it is assumed that there are traders aiming to sell from the range high.
If the last swing high on the 4-hour chart is broken to the upside on a 4-hour close, the short strategy will be invalidated, and I will look for pullback buying opportunities.