
USDJPY Market Analysis and Trading Strategies.
*Personal Opinion
I use “XMTRADING” as my trading tool.

It is my personal most trusted trading account and is used by many professional traders.
I use “TradingView” as my analysis tool.
Registering an account gives you access to many features for free.
Waveforms of each time leg
Weekly
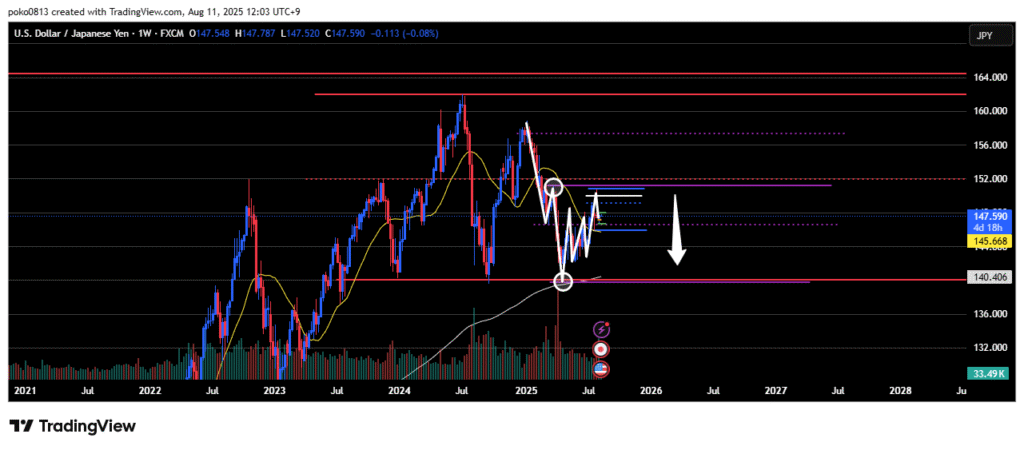
Downtrend.
The price rose to the last swing high line but bounced at that price level.
The bias remains bearish unless the last swing high line is clearly broken to the upside.
Daily
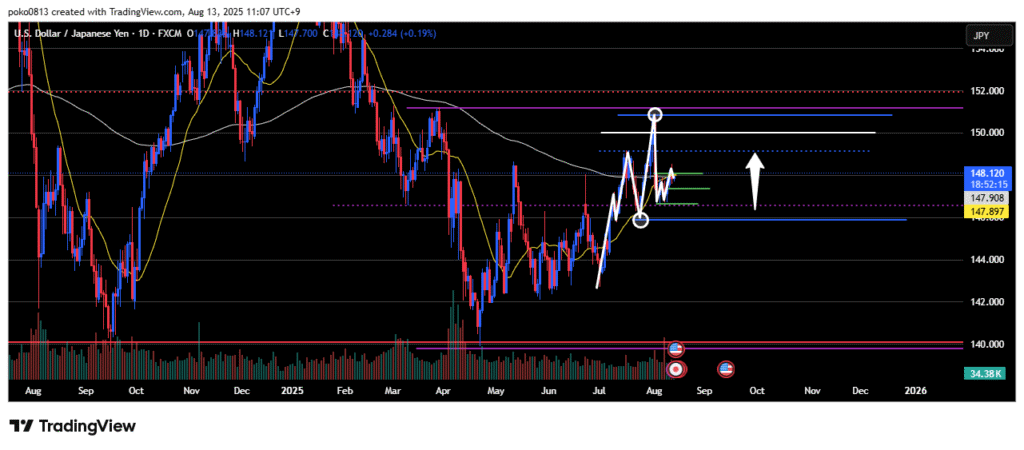
Uptrend.
The price fell to around the last swing low, consolidated slightly, and then began to rise.
It may continue to climb toward the most recent high.
While there is a possibility of a pullback at the previous high or a key round number, at present there are no other major resistance zones.
4-Hour
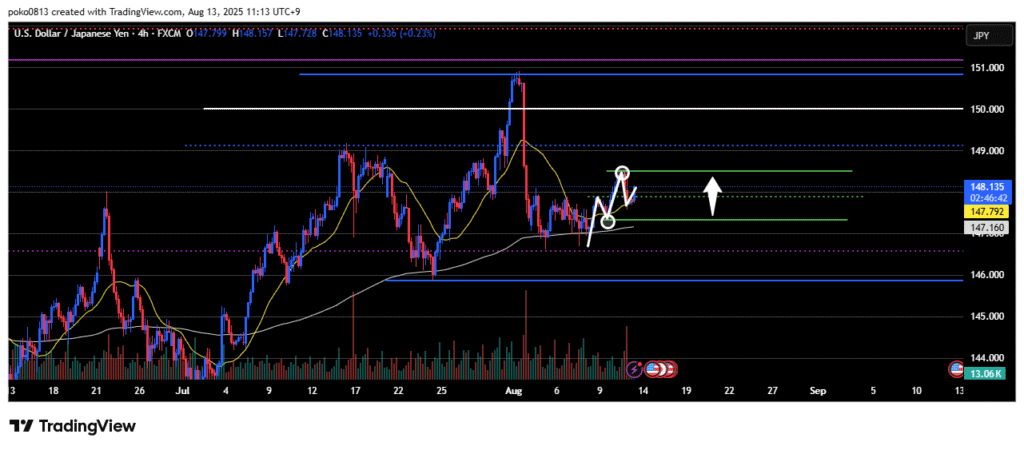
Uptrend.
The previous high line was not strongly respected, and after slightly breaking above it, the price rebounded and moved higher.
Is the 21-day moving average being respected?
The outlook remains bullish unless the last swing low is clearly broken to the downside.
1-Hour
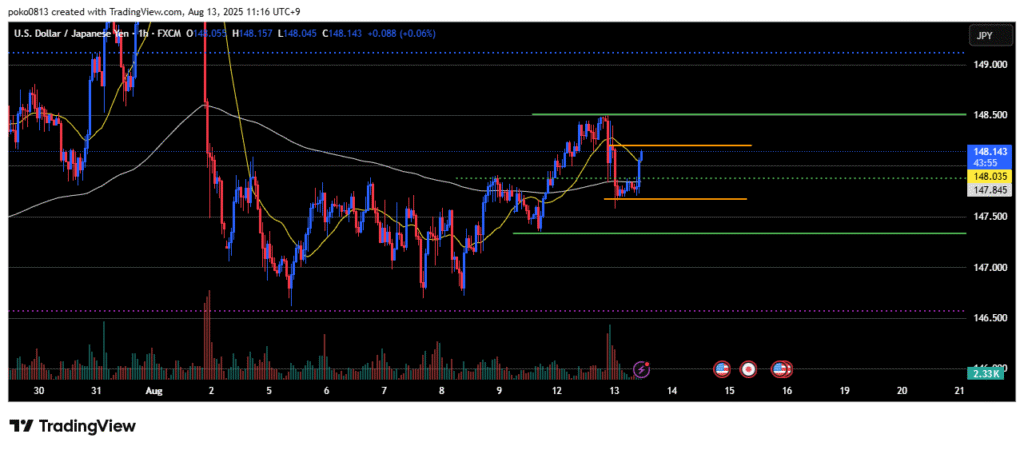
The release of U.S. economic data caused a temporary sharp price movement, creating some confusion.
I’m currently leaning toward a bearish outlook, but the last swing high is unclear, and it’s uncertain whether technicals are functioning properly.
Trade Strategies
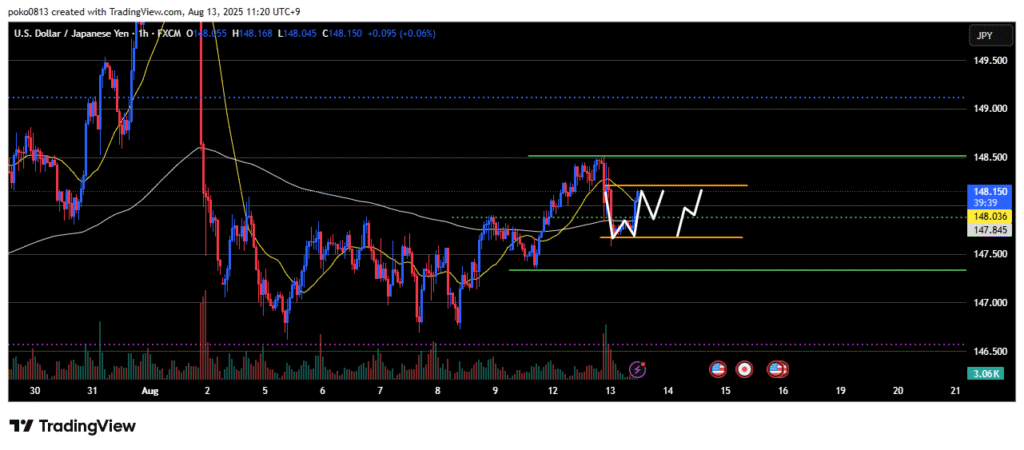
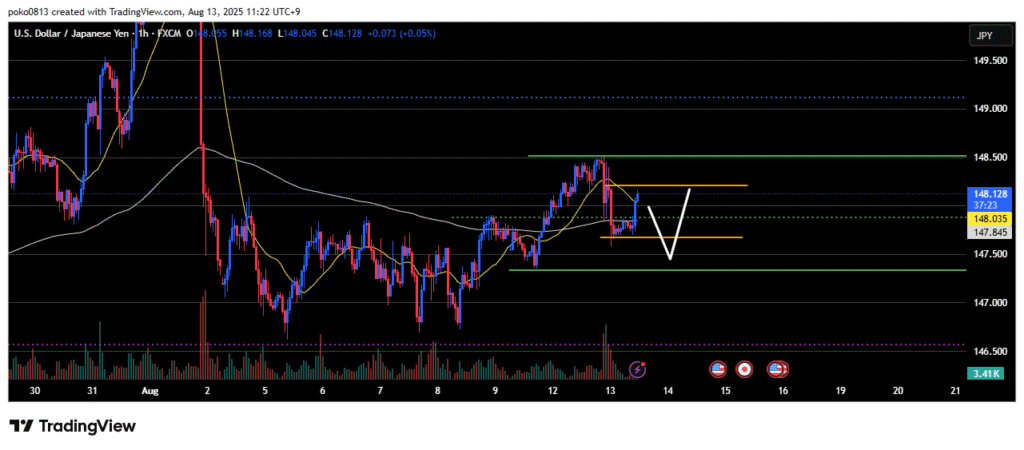
If the price falls to around the lower boundary of the 1-hour range, I will take a long position.
Alternatively, I may assume the current chart is forming a small double bottom and consider a pullback buy at the neckline.
If the price falls to around the last swing low on the 4-hour chart, I will consider a pullback buy at that price level.
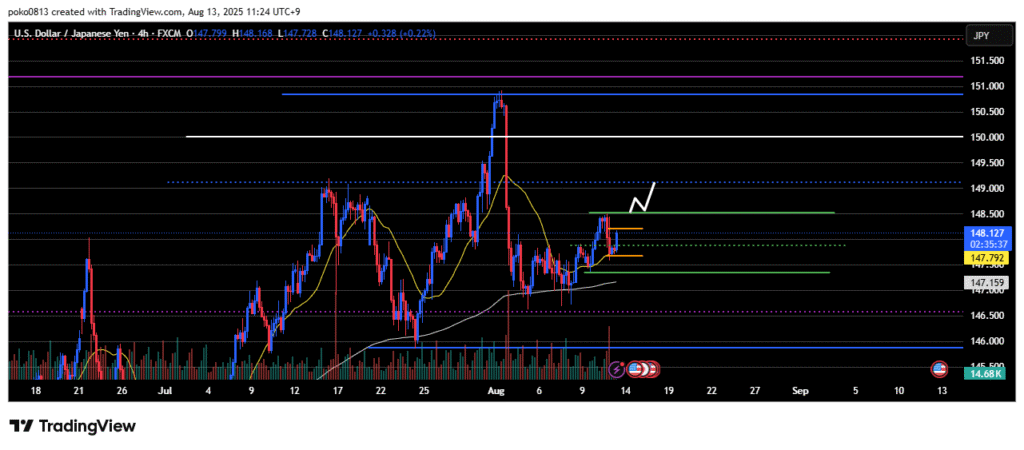
If the recent high on the 4-hour chart is broken, I will consider a new pullback buy.
However, it’s unclear how long this 4-hour uptrend will continue, and based on Elliott Wave counting, there’s a possibility that it is already in the 5th upward wave, so I will keep that in mind.
Update
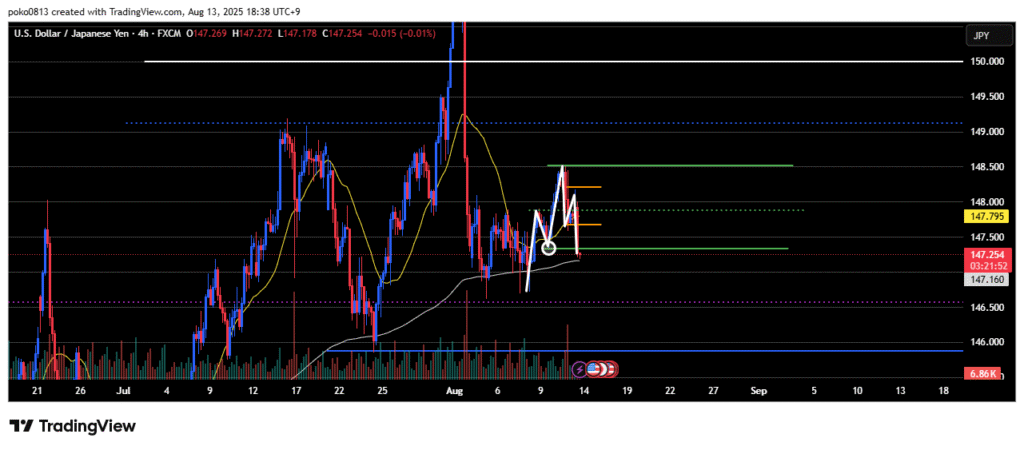
The price broke below the last swing low line on the 4-hour chart with a candle body close.
I just hit my stop-loss.
As a result, the buy strategy is temporarily off the table.

I am considering a short entry after the price pulls back once from the current level.