
USDJPY Market Analysis and Trading Strategies.
*Personal Opinion
I use “XMTRADING” as my trading tool.

It is my personal most trusted trading account and is used by many professional traders.
I use “TradingView” as my analysis tool.
Registering an account gives you access to many features for free.
Waveforms of each time leg
Weekly

Downtrend.
Within the price range between the most recent low and the last swing high, an uptrend has formed on the lower timeframes.
On the weekly chart, the outlook remains bearish until the last swing high line is clearly broken to the upside.
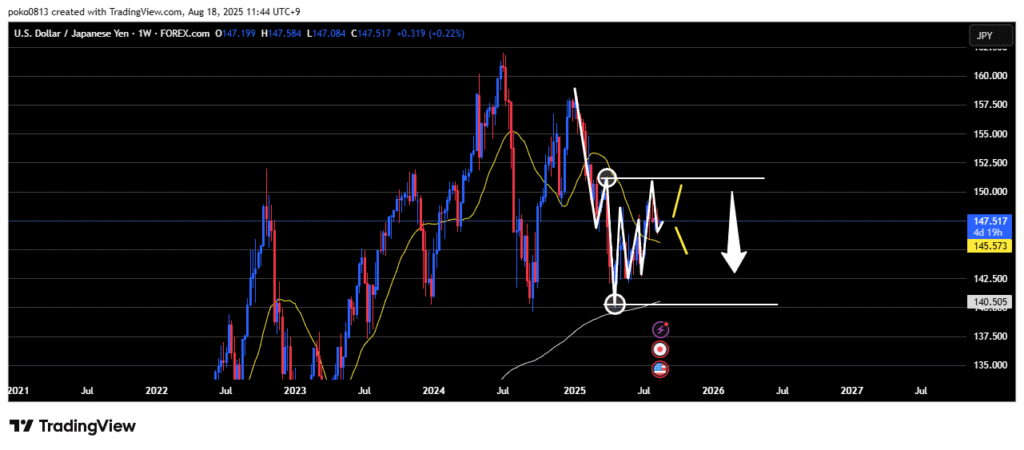
Will the price rise again toward the last swing high line,
or will it continue to decline from here?
Daily
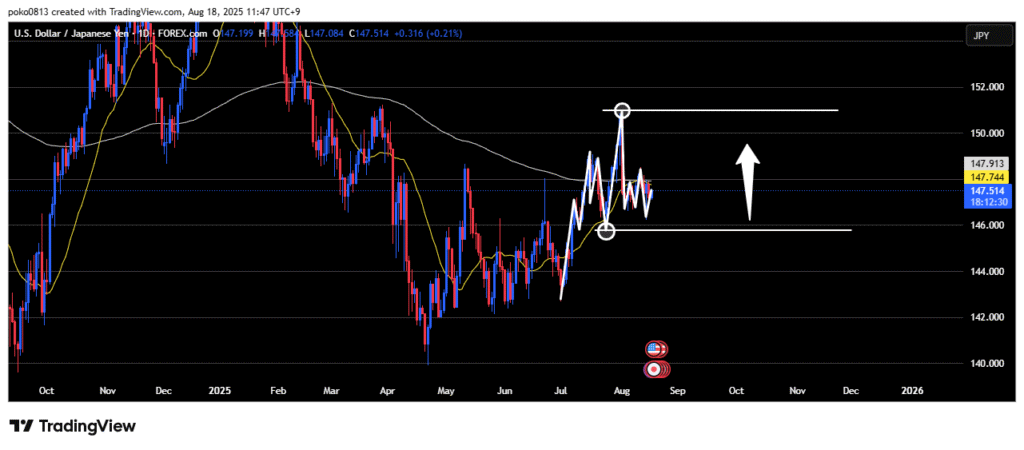
Uptrend.
As long as the last swing low line is not clearly broken to the downside,
the daily outlook remains bullish.
Price has dropped to around the last swing low line and rebounded.
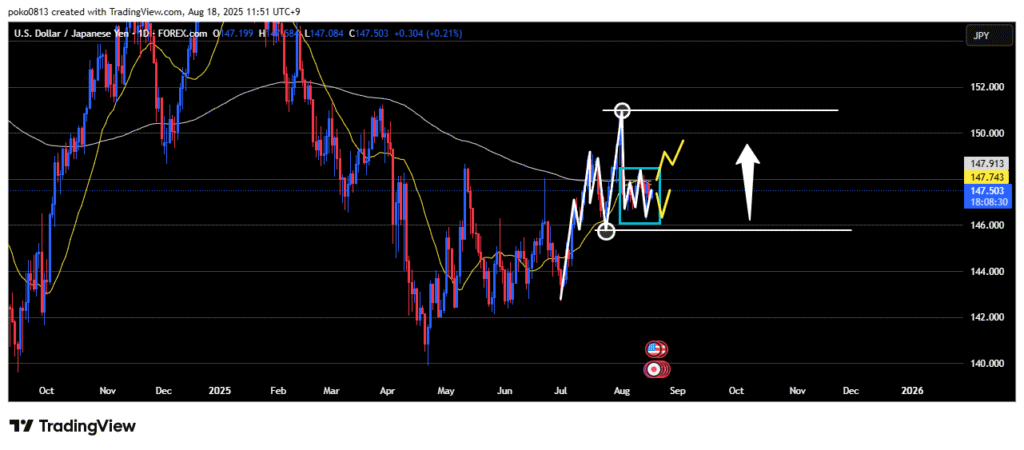
From here, it could either continue rising,
or form something like a double bottom before moving higher.
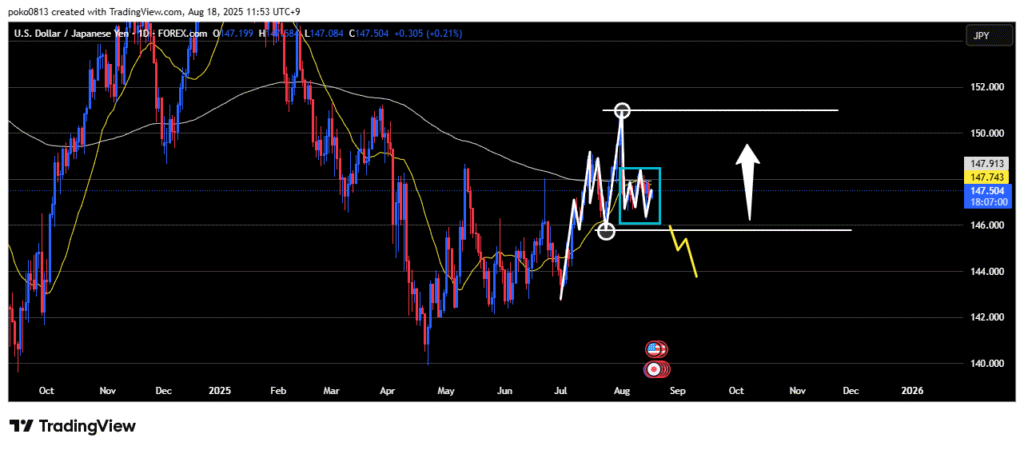
If the daily chart’s last swing low line is broken to the downside, I expect the bearish bias to strengthen further.
4-Hour
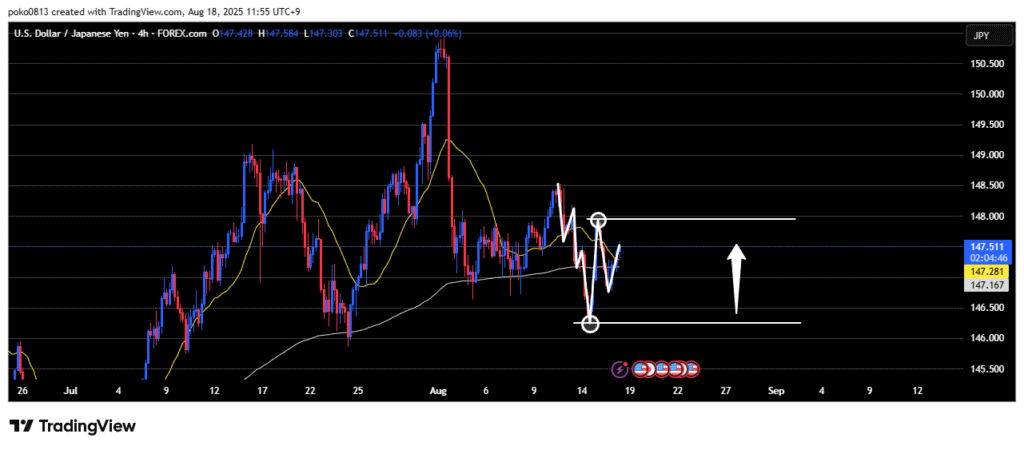
An initial upward wave has occurred, breaking the recent downtrend.
Until the origin line of the most recent high is clearly broken to the downside, the 4-hour chart remains bullish.
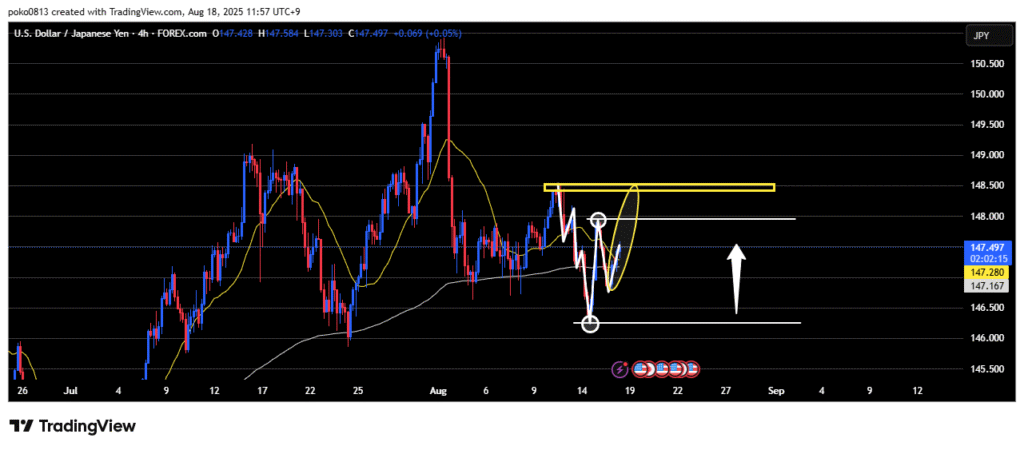
Whether the current wave will become Elliott Wave’s upward 3rd wave remains to be seen.
If it does turn into the 3rd wave, there is room for the price to rise up to the yellow price zone shown in the chart.
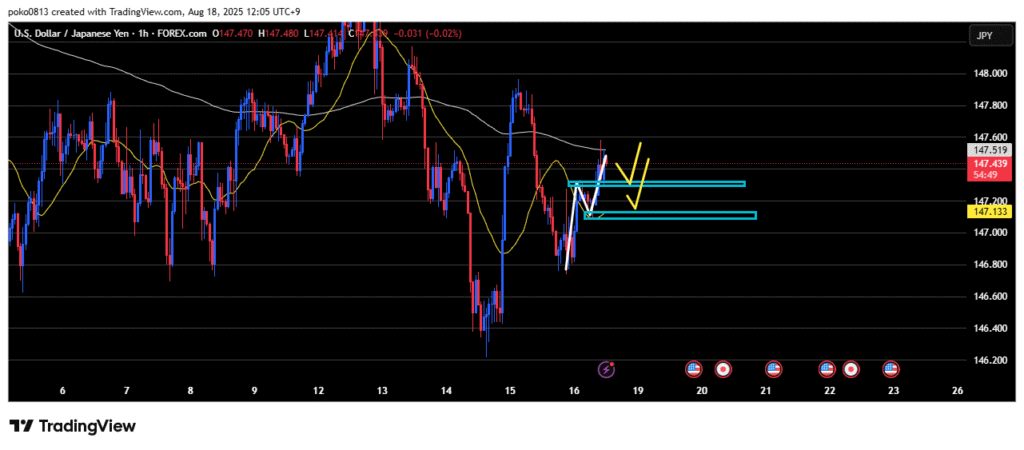
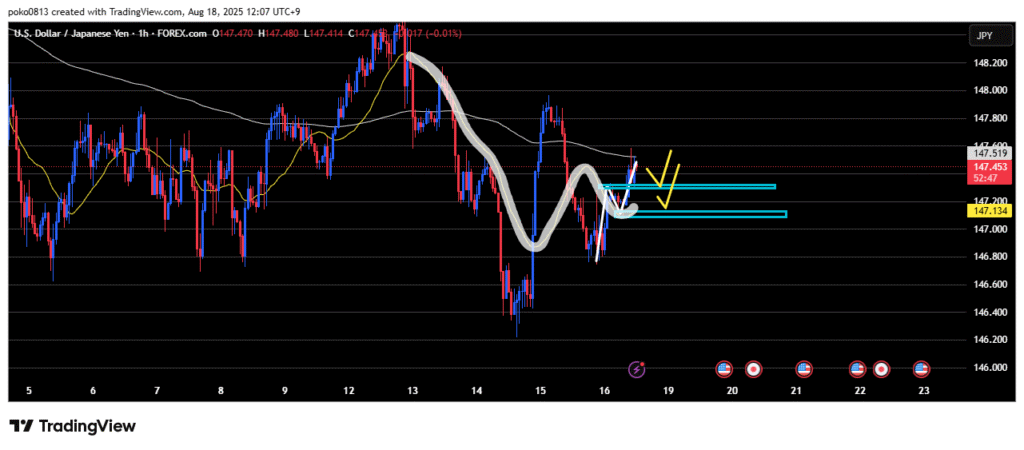
1-Hour
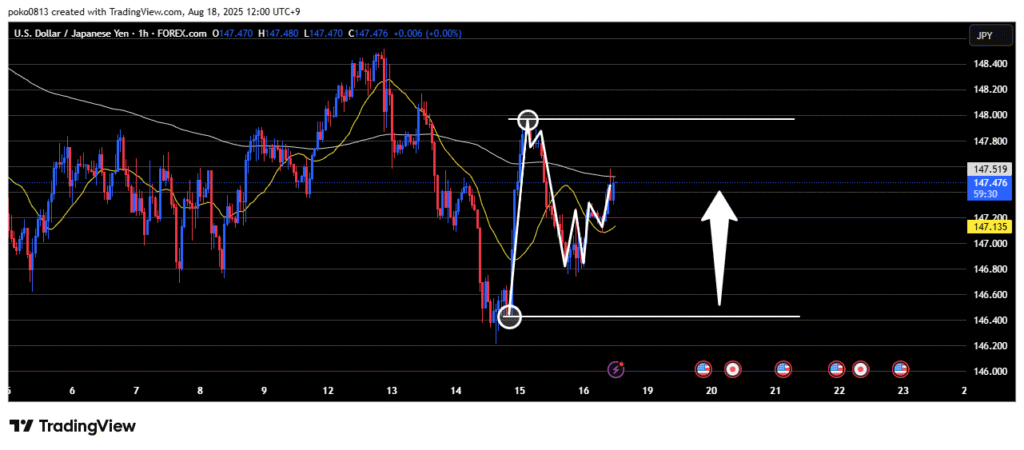
A sharp rally has broken the downtrend.
On the 1-hour chart, the outlook remains bullish unless the starting point of the recent highest high is clearly broken to the downside.
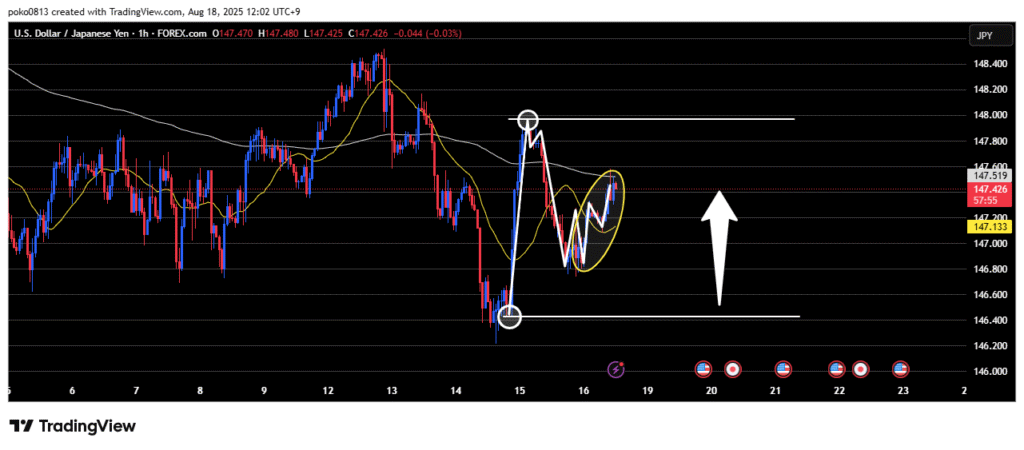
Currently, within a wide price range, an uptrend has formed on the lower timeframes.
Trade Strategies
Riding the short-term uptrend, buying the dip.
The price zones of interest are the previous high of the recent trend and the last swing low line.
Also pay attention to the 21-period moving average on the 1-hour chart.
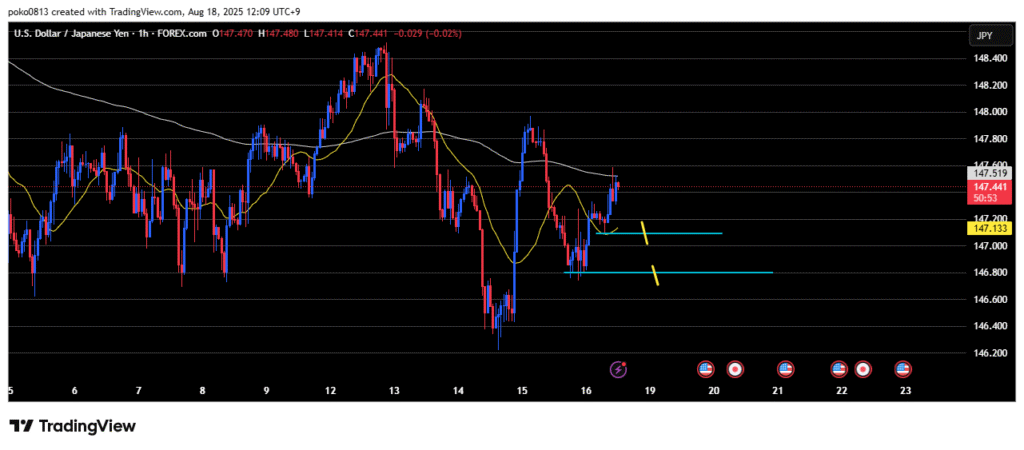
If entering based on the short-term chart, set the stop loss when the swing low of the short-term trend is broken to the downside.
If entering based on the 4-hour chart, set the stop loss when the origin line of the potential 3rd wave on the 4-hour chart is broken to the downside.