
USDJPY Market Analysis and Trading Strategies.
*Personal Opinion
I use “XMTRADING” as my trading tool.

It is my personal most trusted trading account and is used by many professional traders.
I use “TradingView” as my analysis tool.
Registering an account gives you access to many features for free.
Waveforms of each time leg
Weekly
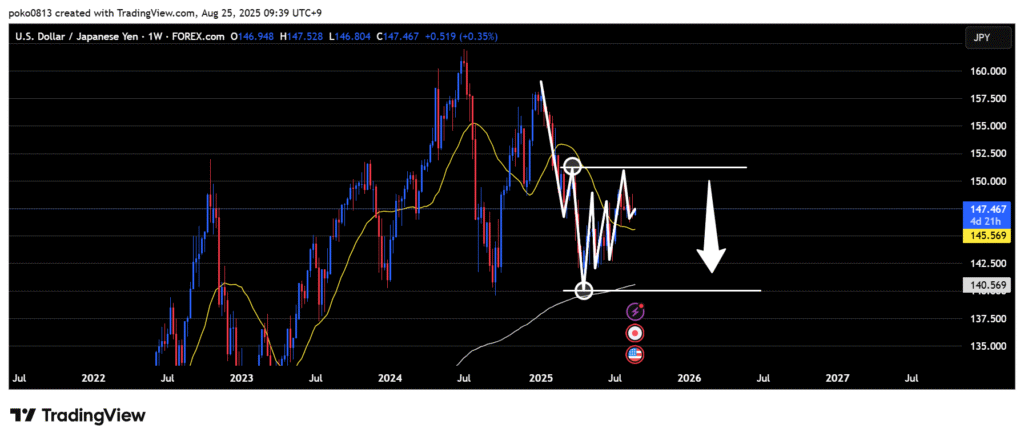
Downtrend.
The price once rose to the last swing high line but failed to break above it and rebounded.
The outlook remains bearish until the last swing high line is clearly broken to the upside.
Daily
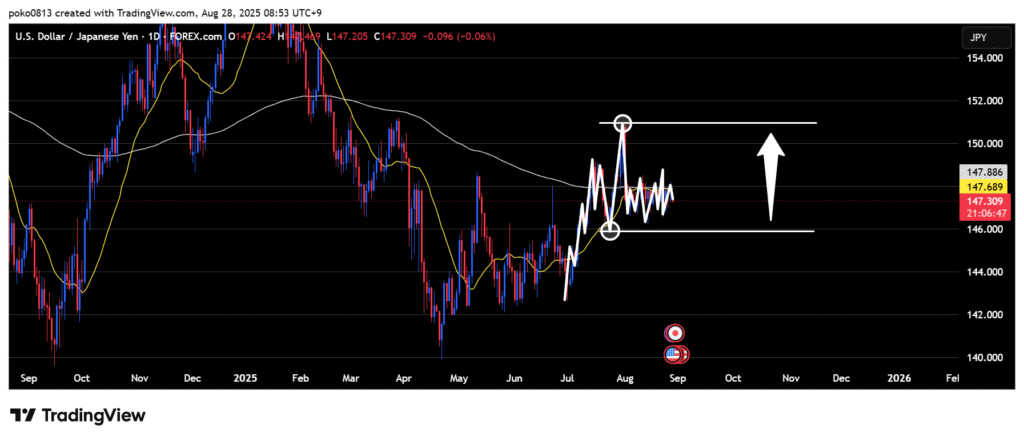
Uptrend.
The outlook remains bullish until the last swing low is clearly broken to the downside.
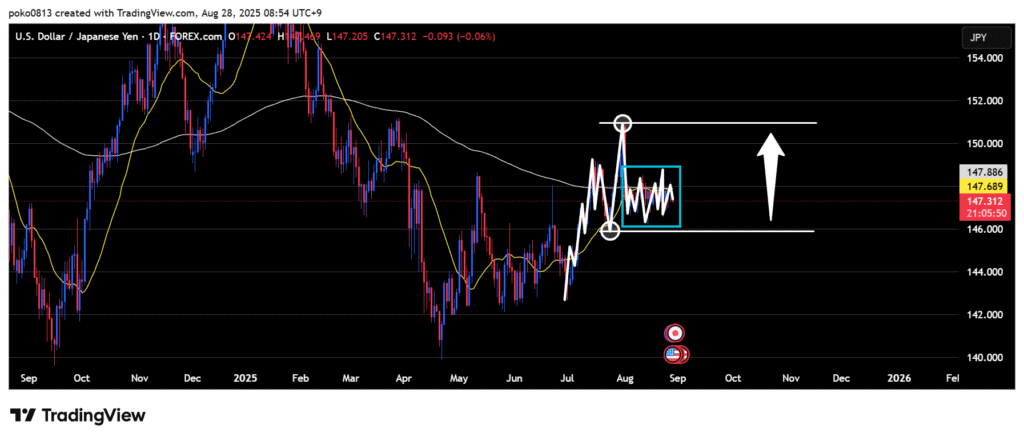
After falling to around the last swing low line, the market has entered a range.
4-Hour
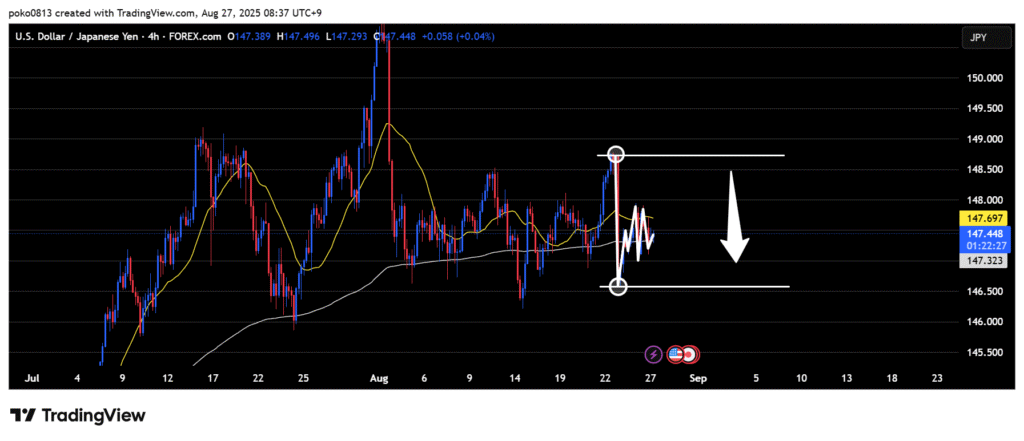
A downward Wave 1 has formed, breaking the uptrend and shifting the outlook to bearish.
The outlook remains bearish until the starting point of the recent lowest low is clearly broken to the upside.
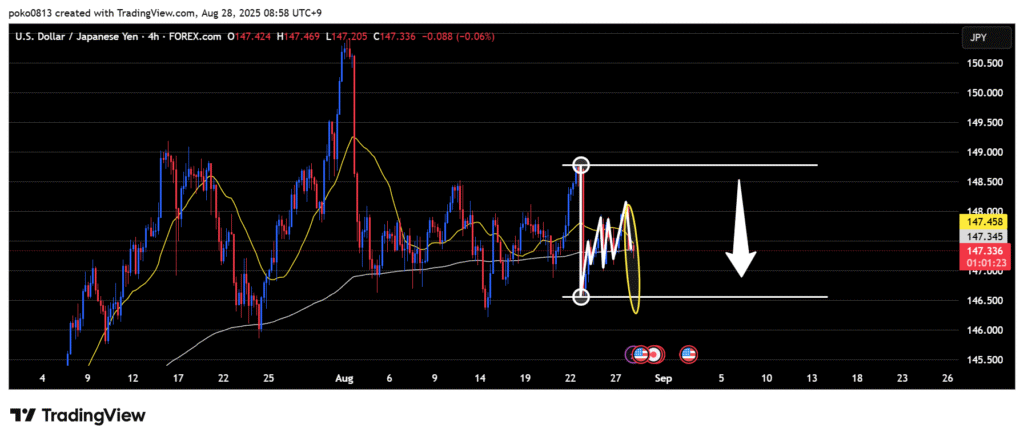
If the current move is a downward Wave 2, the question is whether a downward Wave 3 will develop next.
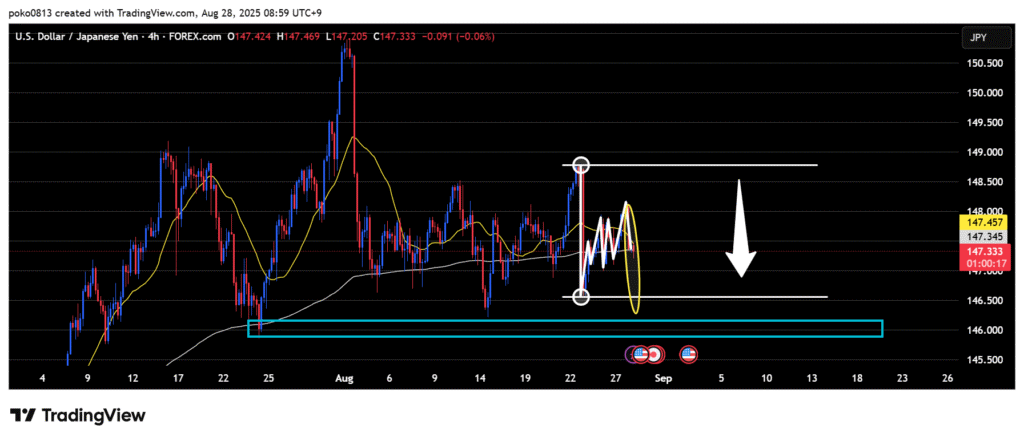
The blue line shown in the image is the last swing low line on the daily chart.
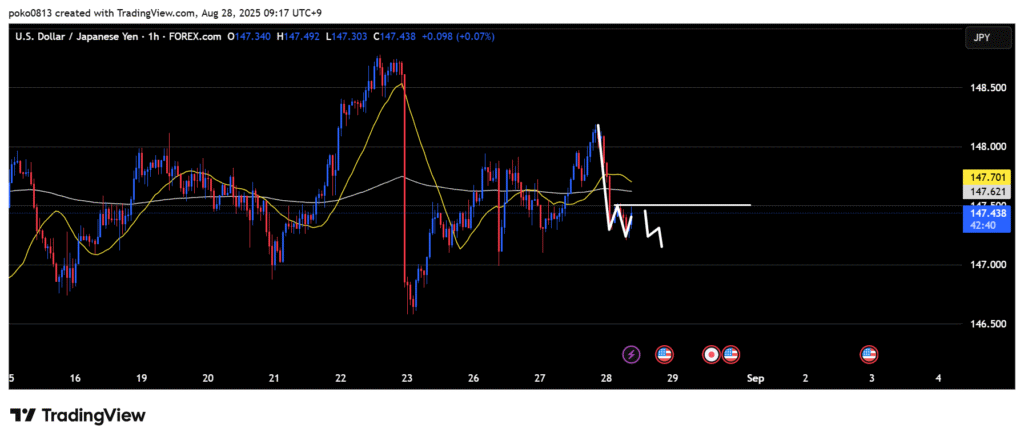
1-Hour
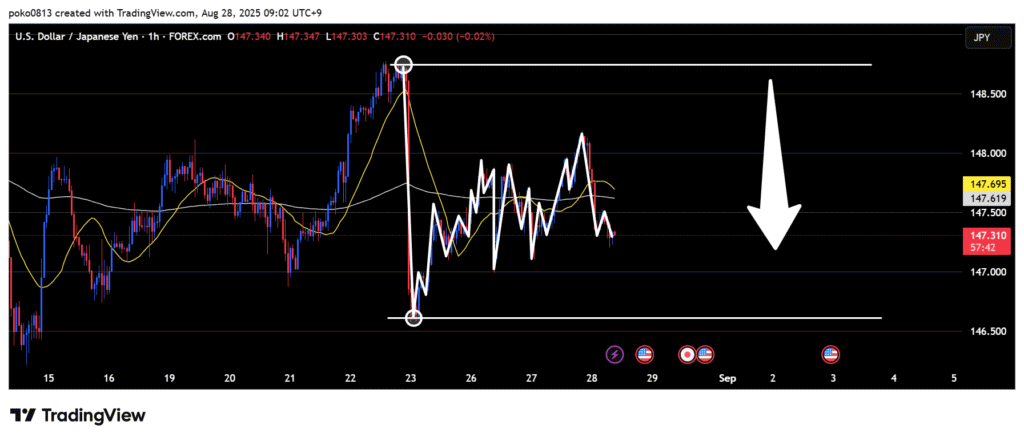
A sharp drop occurred, breaking the uptrend and shifting the outlook to bearish.
As with the 4-hour chart, the outlook remains bearish until the starting point of the recent lowest low is clearly broken to the upside.
Trade Strategies
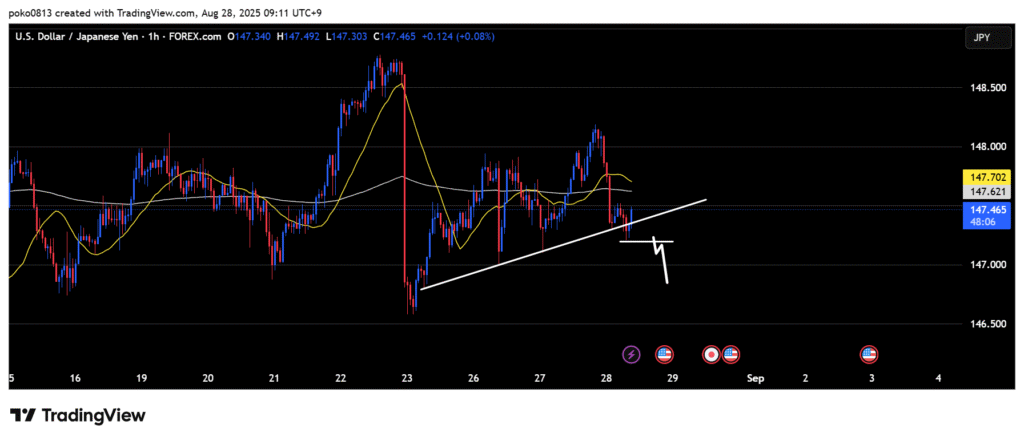
The uptrend trendline forming on the lower time frames has been broken.
However, at the moment it looks like a false breakout.
If the price closes below the candle that broke the trendline, I will consider a short entry.

A pullback sell at the recent trend reversal line on the lower time frames, as seen on the 1-hour chart.
A pullback sell around the last swing high line.
However, since the 5-minute chart has already shifted to a bullish outlook, it’s better to wait until it turns bearish again before entering.