In Elliott Wave Theory, an impulse wave is one of the key types of motive waves that moves in the direction of the overall trend.
Among the five basic wave patterns, the impulse wave often shows the most significant price movement and holds the greatest potential for profit in trading.
On the other hand, failing to recognize an impulse wave and trading against it can carry a high risk of substantial losses due to its strong and persistent trend.

If you can spot it, it’s your biggest opportunity.
If you miss it, it’s your biggest danger.

Exactly!
When it comes to impulse waves, the key to big profits is staying with the trend.
Always trade with the impulse, not against it!
This article provided a summary of the basic knowledge and key characteristics of the impulse wave, one of the main types of motive waves in Elliott Wave Theory.
I use “XMTRADING” as my trading tool.

It is my personal most trusted trading account and is used by many professional traders.
I use “TradingView” as my analysis tool.
Registering an account gives you access to many features for free.
What Is Elliott Wave Theory?
Elliott Wave Theory is the idea that markets move in repeating, cyclical patterns that reflect the collective psychology of human behavior.
According to this theory, price movements are not random—they follow identifiable wave patterns driven by crowd sentiment.
The theory is built on three core principles:
- Markets advance in 5-wave patterns and correct in 3-wave patterns
— Price trends unfold in a five-wave structure, followed by a three-wave correction. - Markets have a fractal structure
— Wave patterns repeat at different scales, from minutes to years, with the same structure. - Market patterns can be categorized into five basic wave types
— All wave movements fit into one of five fundamental forms.
For more details on Elliott Wave Theory itself, be sure to check out the article below!
Elliott Waves Made Simple: Master Elliott Waves Techniques In Less Than 48 Hours
In this article, we break down one of the fundamental wave patterns—the Impulse—by covering its three core rules, typical characteristics, and how to count it properly!
Three Rules of an Impulse Wave
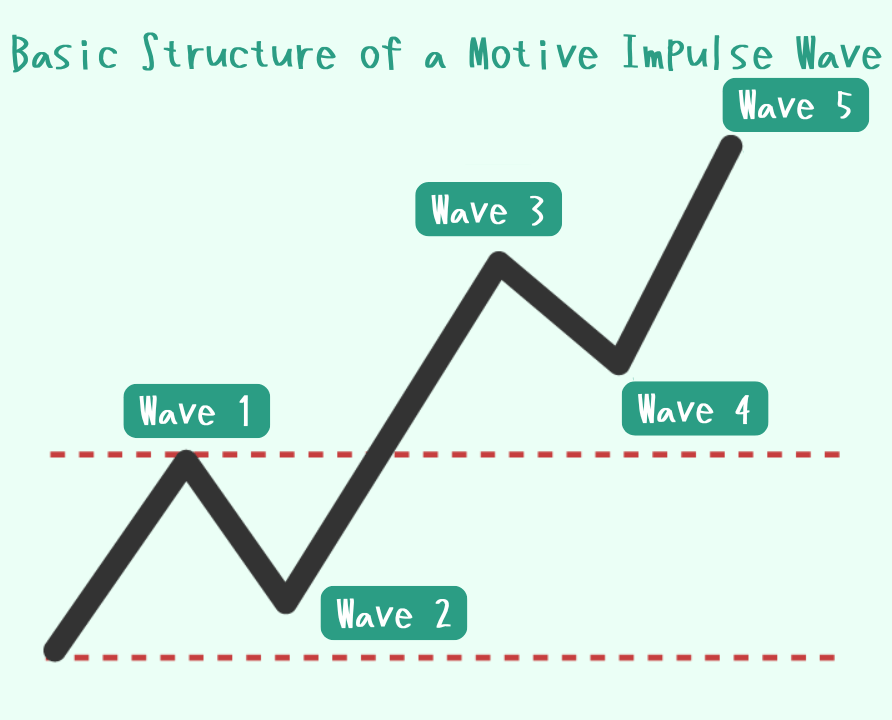
The Impulse wave, like the Diagonal, is classified as a motive wave in Elliott Wave Theory.

What sets the impulse apart from a diagonal is its clear, strong price movement and larger price range.
To determine whether a price movement qualifies as an impulse, the following three conditions related to its sub-waves must be met:
- Wave 2 must not retrace more than 100% of Wave 1.
- Wave 3 must not be the shortest among Waves 1, 3, and 5.
- Wave 4 must not overlap the price territory of Wave 1.
So if these three conditions aren’t all met, it can’t be called an “Impulse,” right?
Exactly! Unless all three rules are satisfied, the wave is either a Diagonal or a Corrective wave.
These conditions are often mistakenly referred to as the “Three Principles of Elliott Wave Theory,” but more accurately, they are the Three Rules of the Impulse Wave.
The actual Three Principles of Elliott Wave Theory are as follows:
- Markets move in 5-wave impulse patterns followed by 3-wave corrections.
- Market price movements exhibit a fractal structure, meaning wave patterns repeat at different time scales.
- All market wave patterns can be classified into five basic wave types.
We have to be careful not to mix them up.
Right! Now, let’s go through each of the conditions one by one.
Condition ① Wave 2 must not retrace more than 100% of Wave 1
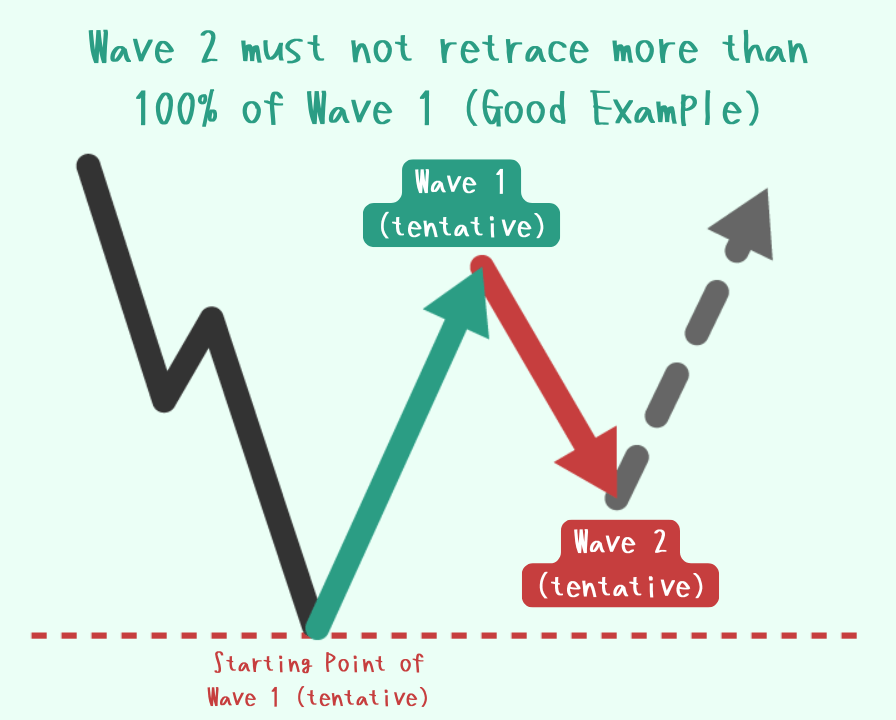
Imagine a downtrend where a temporary upward movement occurs against the prevailing direction.
If we assume this upward move is Wave 1, and the subsequent downward move, Wave 2, does not fall below the starting point of Wave 1 before reversing upward again and surpassing the end of Wave 1, then this pattern can be considered a potential Impulse wave.
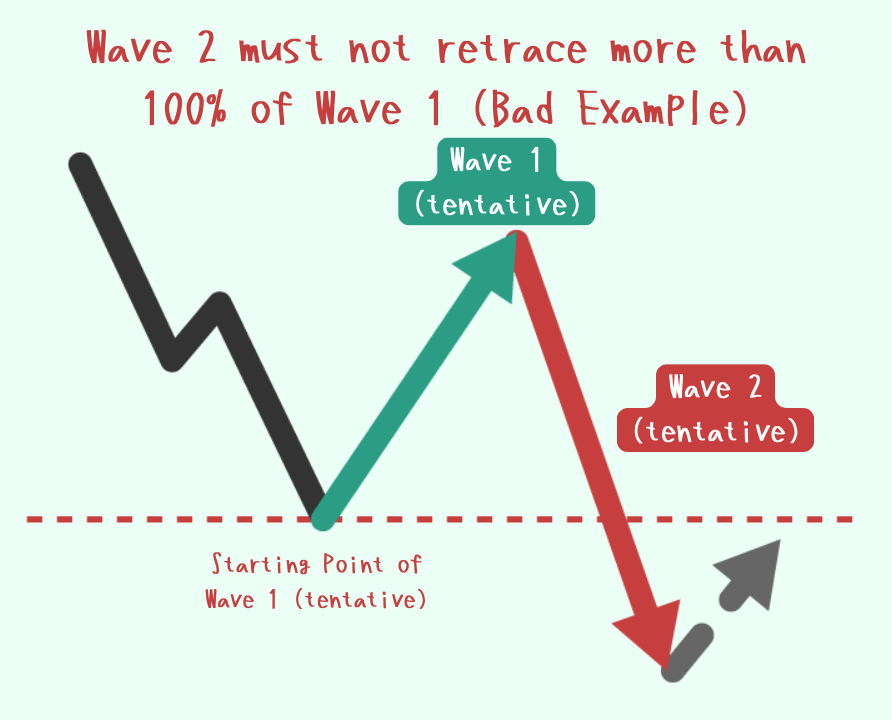
Conversely, if the downward move assumed to be Wave 2 falls below the starting point of Wave 1—that is, below the most recent low—then the possibility of a valid upward impulse wave forming is low.
Unless Condition ① is met, it is impossible to consider the pattern as a valid Impulse wave.
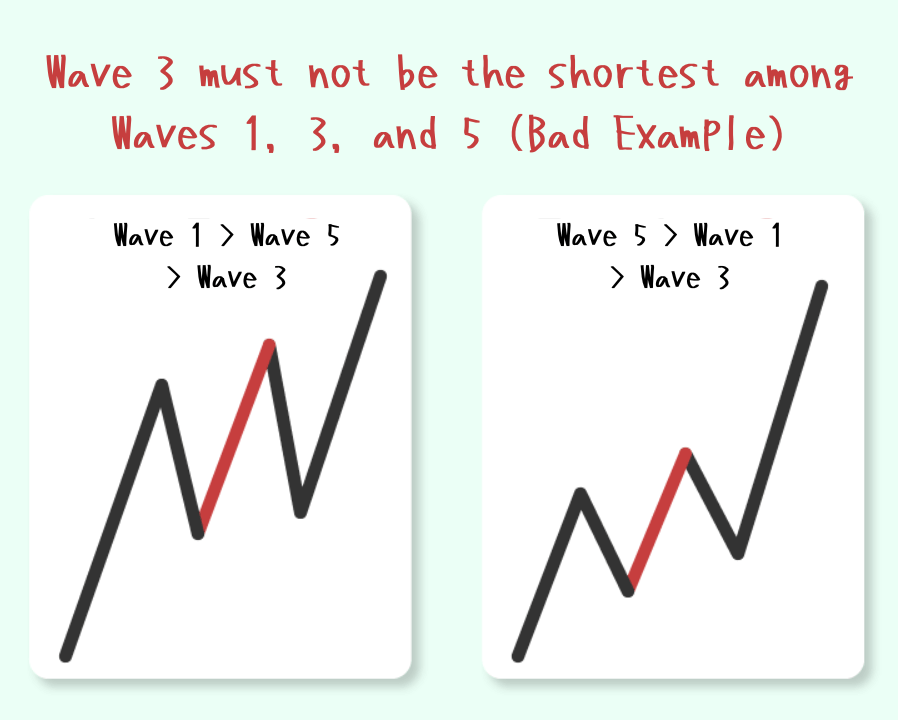
Condition ② Wave 3 must not be the shortest among Waves 1, 3, and 5.
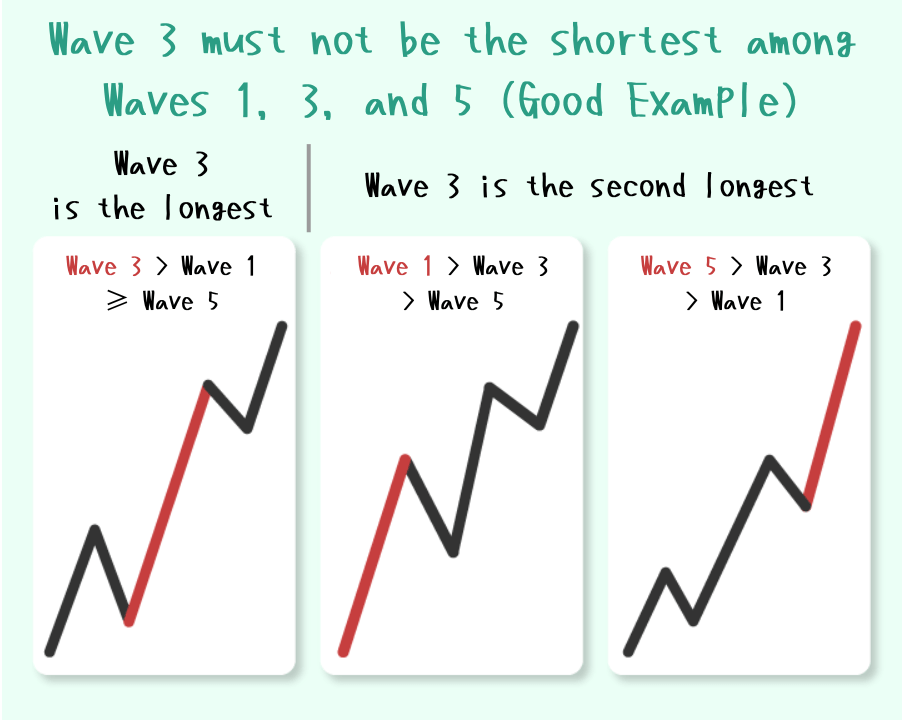
In an Impulse wave, Wave 3 is never the shortest among the motive waves.
There are three typical size relationships observed among the impulse waves.
- Wave 3 > Wave 1 ≥ Wave 5
ーWave 3 has the largest price range (the order of Waves 1 and 5 doesn’t matter). - Wave 1 > Wave 3 > Wave 5
ーWave 1 has the largest price range (Wave 3 is the second largest). - Wave 5 > Wave 3 > Wave 1
ーWave 5 has the largest price range (Wave 3 is the second largest).
By “size” here, you mean the price range, right?
Exactly!
It’s about the price movement, not the duration of the wave—so don’t get them confused!
In real markets, it’s also common to see situations where Waves 1, 3, and 5 are roughly the same size or where the movement appears to have seven waves instead of five.
Having Waves 1, 3, and 5 of almost equal size isn’t a problem and can still fit within Elliott Wave patterns.
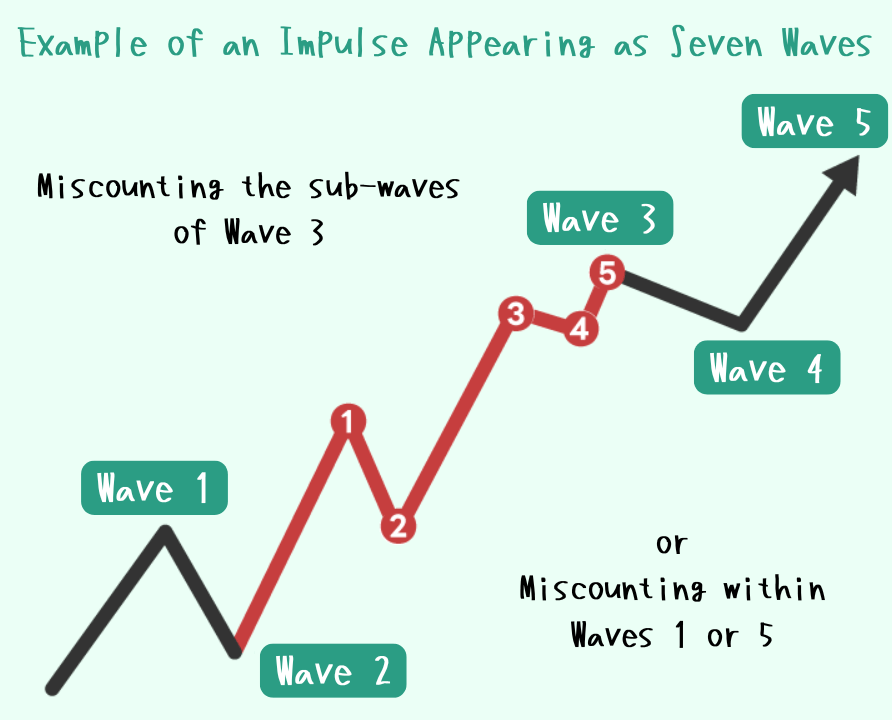
Cases That Appear as Seven Waves
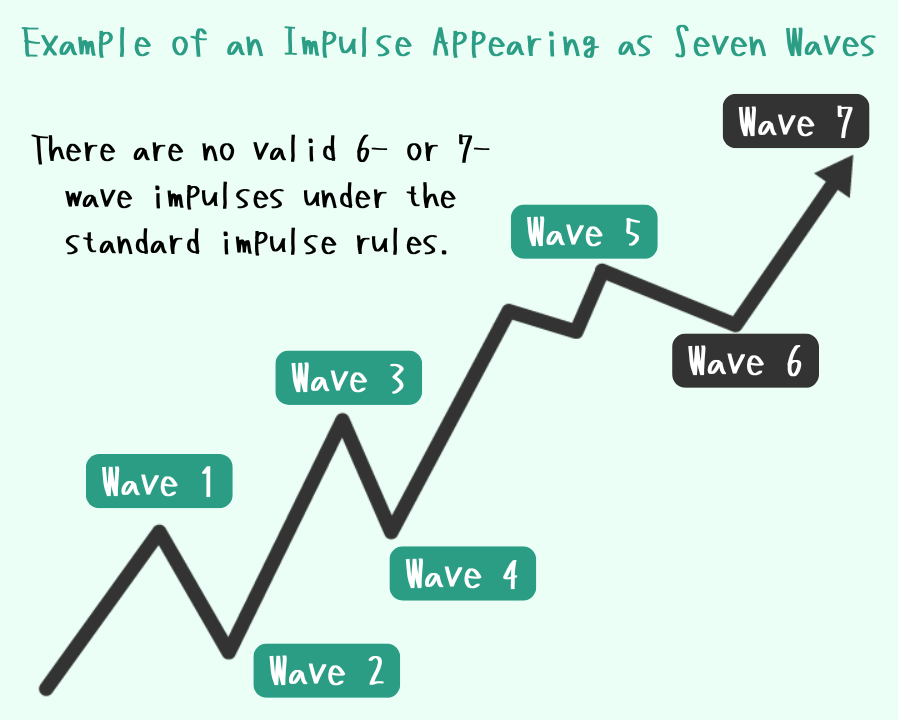
Sometimes, one of the sub-waves within Waves 1, 3, or 5 becomes extended, making the overall movement appear as if it has 7 waves—this is known as a 7-wave count.
This phenomenon is more commonly observed on shorter timeframes compared to higher timeframes.
Be careful not to assume “the 5-wave pattern is complete!” and jump into a counter-trend trade too soon.
If your wave count is off—especially due to a miscount within Waves 1, 3, or 5—you risk getting caught in an ongoing impulse and facing a sharp move against your position.
Condition ③ Wave 4 must not overlap the price territory of Wave 1
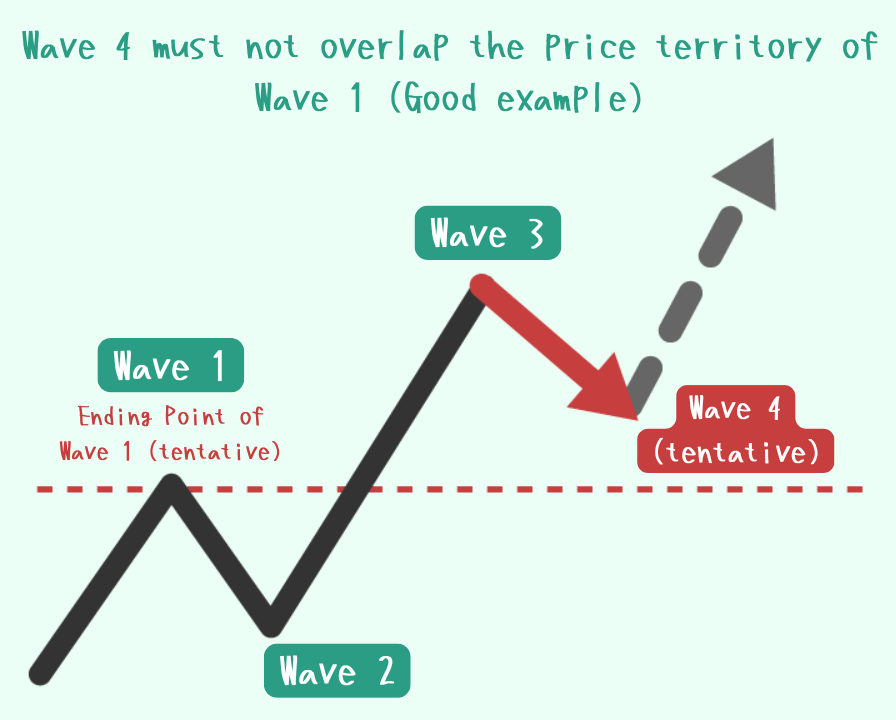
In an expected impulse pattern, Wave 4 must not fall below the end point of the tentative Wave 1.
If the corrective Wave 4 completes successfully above that level, the next move—Wave 5 in the direction of the trend—can be anticipated.
However, if Wave 4 drops below the end of Wave 1, the impulse scenario is invalidated, and the structure should be reconsidered.
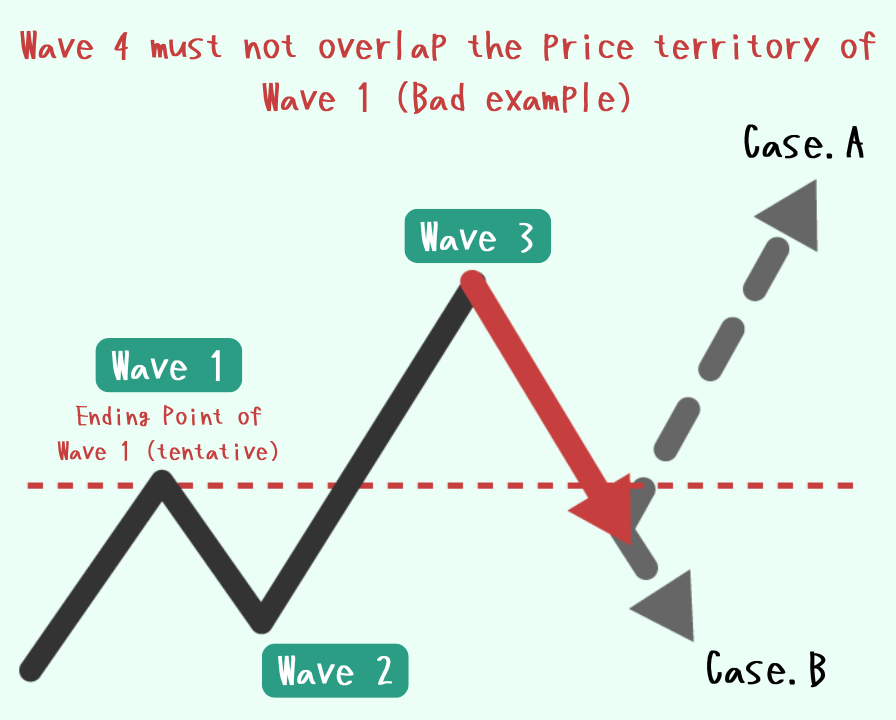
The two most common alternative scenarios to consider when the impulse structure is invalidated are:
Case A: Diagonal Scenario
Wave 5 still forms, and price continues moving in the direction of the trend.
— Overlap between Wave 1 and Wave 4 is acceptable in diagonals, so the structure remains valid.
Case B: Beginning of a Corrective Wave
What was assumed to be Waves 1 through 3 may actually have been part of a larger corrective structure.
— A new trend may begin in the opposite direction, invalidating the prior impulse assumption.
Case A ends up moving in the same direction as the impulse, so even if it’s a diagonal, there’s no major issue.
Exactly.
But in Case B, since the price starts moving in the opposite direction, you’ll likely need to cut your losses quickly.
To anticipate whether the price is more likely to follow Scenario A or Scenario B, it’s essential to understand the broader trend by analyzing a higher timeframe than the one you’re currently viewing.
This larger context helps determine whether the move is part of a continuing trend (supporting Scenario A) or the beginning of a reversal (supporting Scenario B).
Typical Characteristics of an Impulse
In addition to the well-known three rules, an impulse wave often exhibits the following three common characteristics:
Unlike the three core rules, these characteristics are not absolute—so be careful not to rely on them too heavily.
They serve as useful guidelines, but exceptions do occur in real market conditions.
Characteristic ① Channel lines tend to be parallel
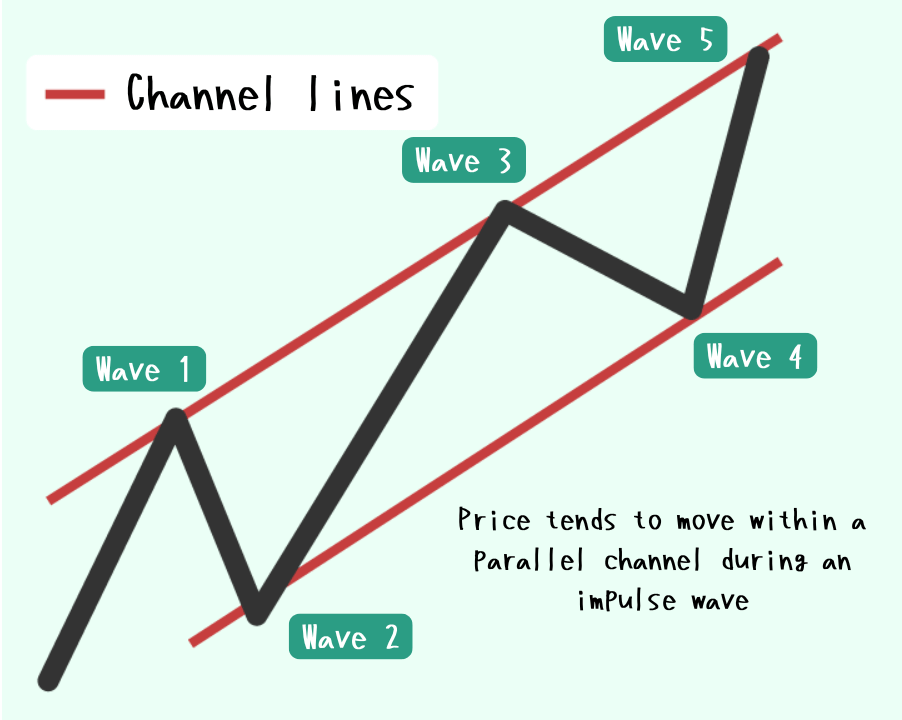
In an Elliott Wave impulse, there’s a tendency for the upper channel line (connecting the ends of Waves 1 and 3) and the lower channel line (connecting the ends of Waves 2 and 4) to form a parallel structure.
While this characteristic doesn’t always appear, the parallelism of these channel lines can serve as a helpful guide for projecting the endpoints of Waves 4 and 5.
Characteristic ② The sub-wave structure follows a 5–3–5–3–5 pattern
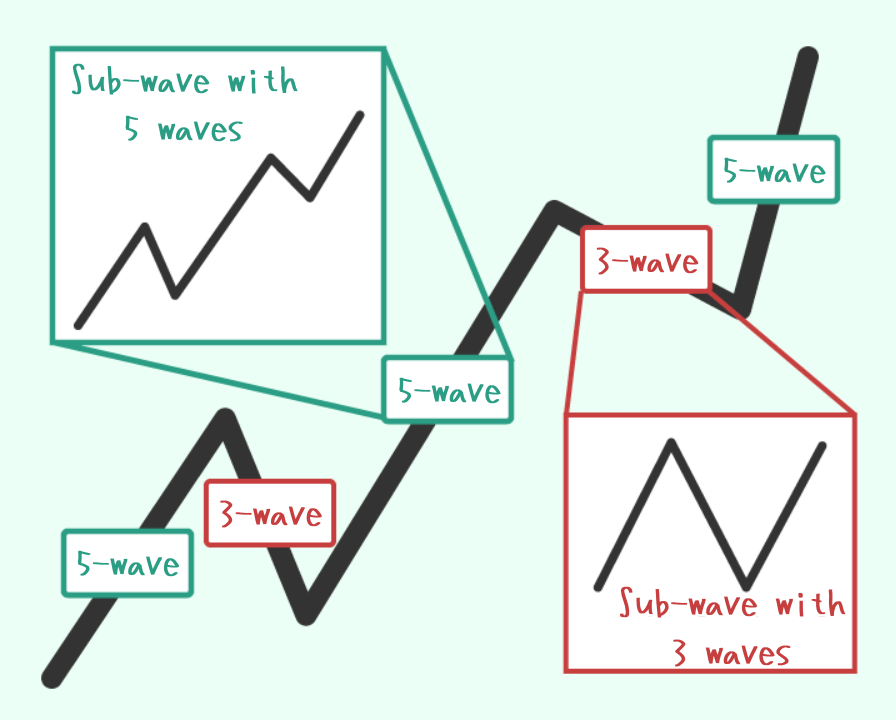
In an impulse wave, the motive waves—Waves 1, 3, and 5—are typically composed of 5 sub-waves, while the corrective waves—Waves 2 and 4—are made up of 3 sub-waves.
This structure generally holds true. However, on shorter timeframes or during choppy market conditions, the sub-wave patterns may become unclear or difficult to distinguish.
Characteristic ③ Fibonacci levels tend to be highly effective
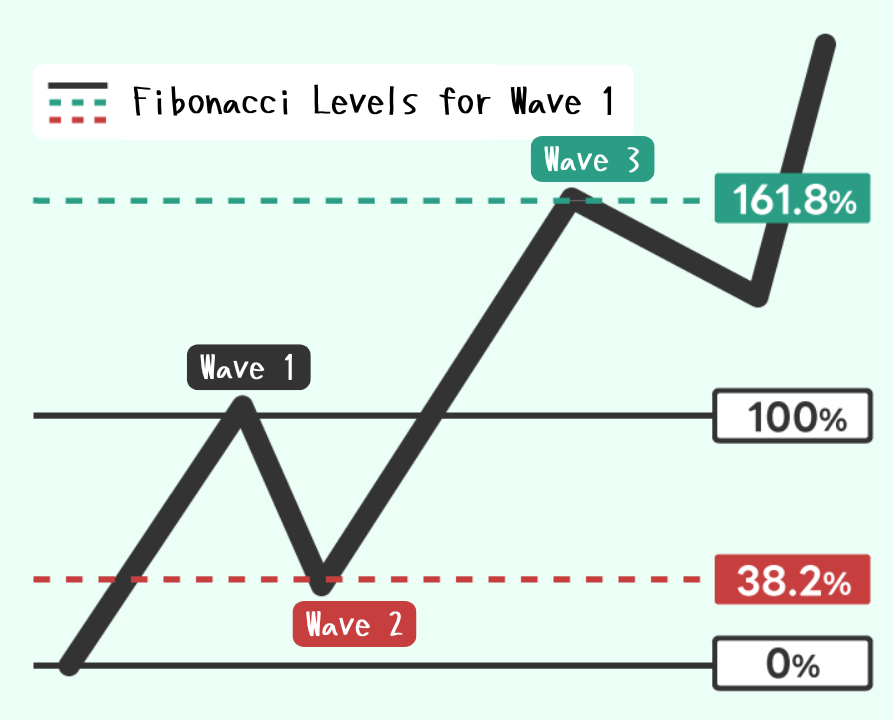
When the length of Impulse Wave 1 is set as 100%, the typical retracement level for Corrective Wave 2 falls within the 38.2% to 61.8% range.
For Impulse Wave 3, its projected end often reaches around 161.8%, and in strong trends, it can extend to 261.8% of Wave 1.
While this pattern does not hold true in every case, price movements in impulse waves often align with key Fibonacci ratios, making them useful reference points in wave analysis.
Waveforms and Counts Where an Impulse Appears
According to the basic Elliott Wave principle of fractal structure, an impulse wave appears as part of a larger wave pattern on higher timeframes.
Specifically, the motive waves—such as Waves 1, 3, and 5—within impulse and diagonal patterns themselves consist of smaller impulse or diagonal waves.
In other words:
The Impulse and Diagonal waves appear repeatedly as sub-waves within the larger Waves 1, 3, and 5.
This fractal nature allows the same wave structures to exist on multiple scales simultaneously.
Motive Waves: Waves 1, 3, and 5 of Impulse and Diagonal Patterns
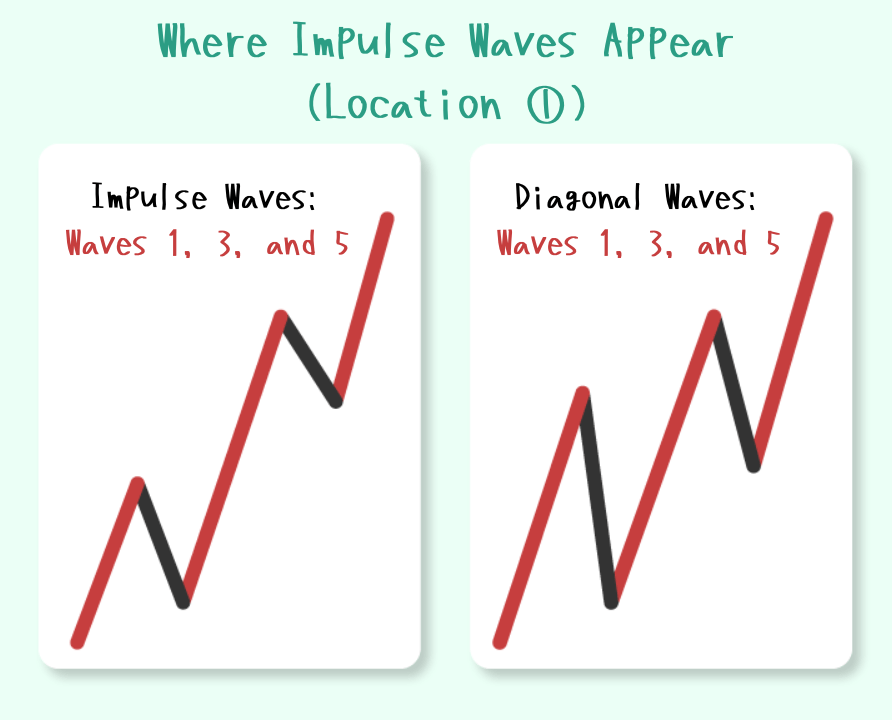
For example, an Impulse wave observed on a 15-minute chart might actually be the Wave 1 of a Diagonal pattern seen on a 60-minute chart.
Corrective Waves: A and C Waves of a Zigzag, and C Wave of a Flat
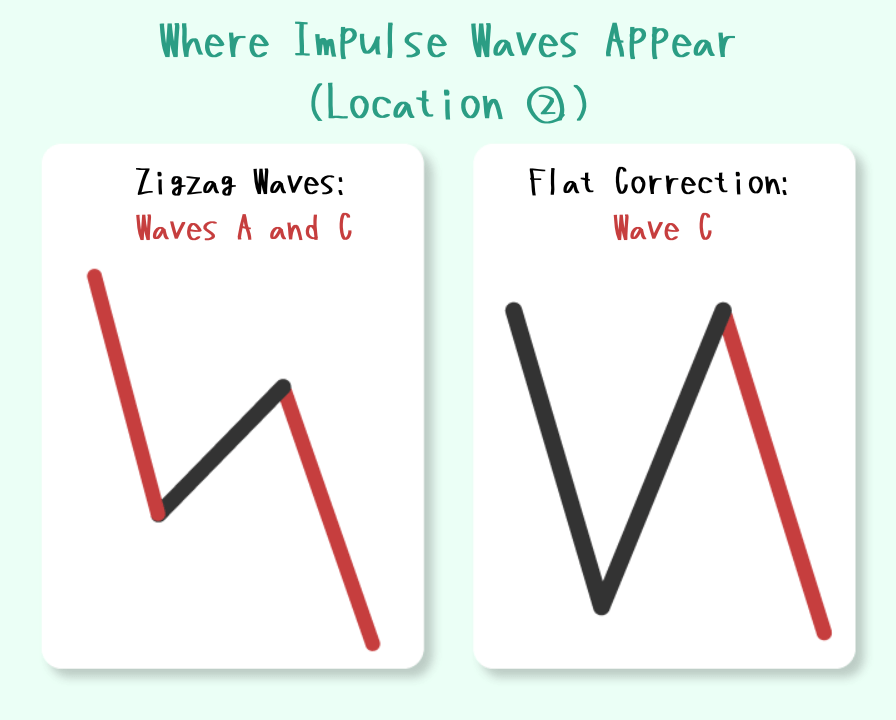
For example, an Impulse wave observed on a 4-hour chart might actually be the C wave of a Flat correction seen on the daily chart.
The market is like a matryoshka doll—Elliott waves are made up of smaller Elliott waves nested inside Elliott waves.
When you get used to multi-timeframe analysis—from long-term to mid-term to short-term—you’ll start to really understand this fractal structure.
Summary
The motive wave called the Impulse has the potential to drive prices strongly in the direction of the trend.
- Wave 2 must not retrace more than 100% of Wave 1.
- Wave 3 must not be the shortest among Waves 1, 3, and 5.
- Wave 4 must not overlap the price territory of Wave 1.
- Channel lines tend to be parallel
- The sub-wave structure follows a 5–3–5–3–5 pattern
- Fibonacci levels tend to be highly effective
All three conditions must be met for a wave to be classified as an Impulse.
The three characteristics, on the other hand, are just common tendencies. They’re not guaranteed to always happen, so keep that in mind!
All of these points are important when analyzing the market with Elliott Wave Theory.
To better distinguish patterns, it’s also recommended to learn about the motive wave called the “Diagonal” alongside the Impulse wave!
If You Want to Learn Elliott Wave Theory, This Book Is Recommended!
Needless to say, when you fail to predict any big movements of the market, trading is more or less a gamble, and things become much more dangerous.
This book would save you from those unexpected situations, and pave the way for consistent profits.
Elliott Waves Made Simple: Master Elliott Waves Techniques In Less Than 48 Hours