By using this theory, traders can better understand market trends and anticipate future price movements.
However, while the theory has its advantages, there are also important cautions to keep in mind. Misusing the theory or relying on it too heavily can lead to costly mistakes.
In this article, we’ll explore both the benefits and the potential pitfalls of using Elliott Wave Theory in market analysis.
Recommended Books
Elliott Waves Made Simple: Master Elliott Waves Techniques In Less Than 48 Hours
Can Be Applied to Both Short-Term and Long-Term Charts (Multi-Timeframe Analysis)
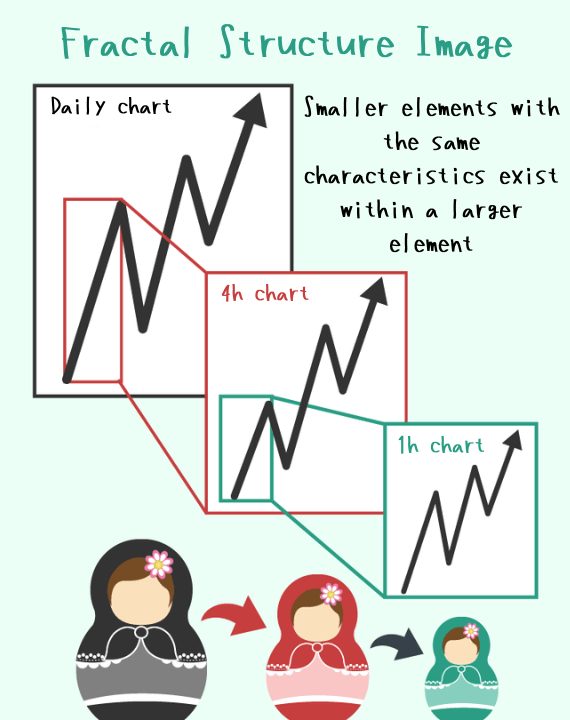
The Elliott Wave Theory is based on the idea that “the market has a fractal structure.”
A fractal structure means that smaller patterns resemble the overall larger pattern.
What Is a “Fractal Structure”?
Think of a fractal structure like a set of Russian nesting dolls—”Matryoshka dolls”—where each smaller doll looks similar to the larger ones.
It’s that repeating pattern where a smaller doll fits inside a larger one, and that continues over and over!
Exactly! Each Elliott Wave is made up of smaller Elliott Waves, following the same pattern on a smaller scale.
Because of this fractal structure, market movements can be analyzed using Elliott Waves—whether you’re looking at the 1-minute chart or the monthly chart.
Since this method isn’t limited to a specific timeframe, it can be applied to various trading styles, such as scalping (very short-term trading), day trading (positions closed within the same day), and swing trading (holding positions for several days to weeks).
However, the shorter the timeframe, the more prone it is to noise—such as wicks, price spikes, and random movements—so caution is needed.
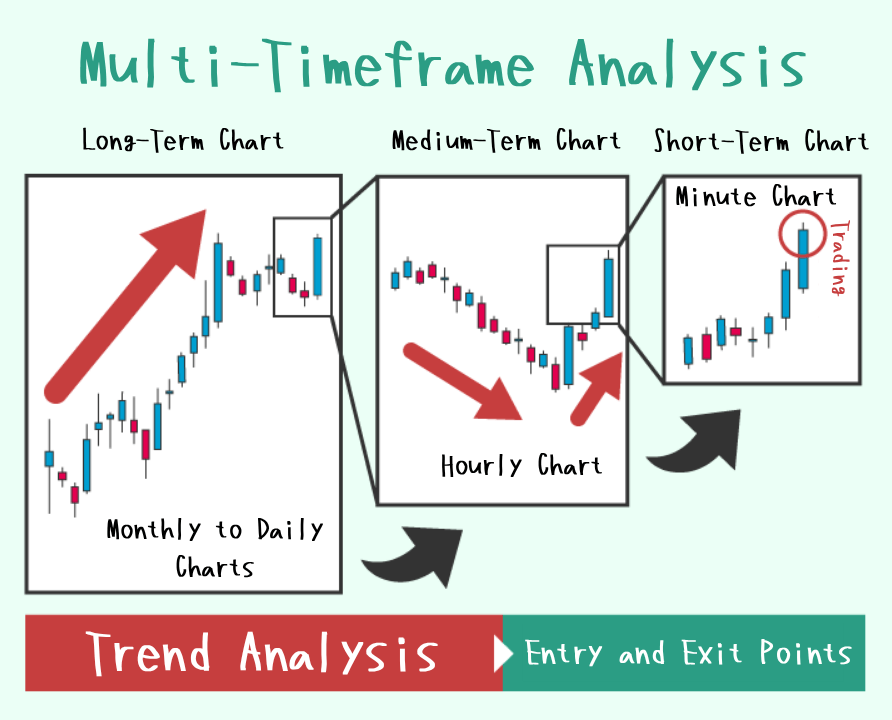
Multi-Timeframe Analysis
When using Elliott Wave Theory, “multi-timeframe analysis” proves to be very effective.
This method involves analyzing and forecasting from the higher timeframes (longer-term charts) downwards.
Starting with the analysis of major trends helps avoid the influence of random noise in shorter timeframes and allows you to build a strategy with fewer contradictions.
Specifically, you first identify the major trend using monthly to daily charts.
Next, you determine the recent trend direction on hourly charts.
Finally, you decide your entry and exit points on minute charts and execute your trades.
It’s important to analyze Elliott Waves starting from the monthly chart, then the weekly chart, followed by the daily chart, and so on—moving from longer to shorter timeframes!
Simple Forecasting and Analysis by Fitting Patterns
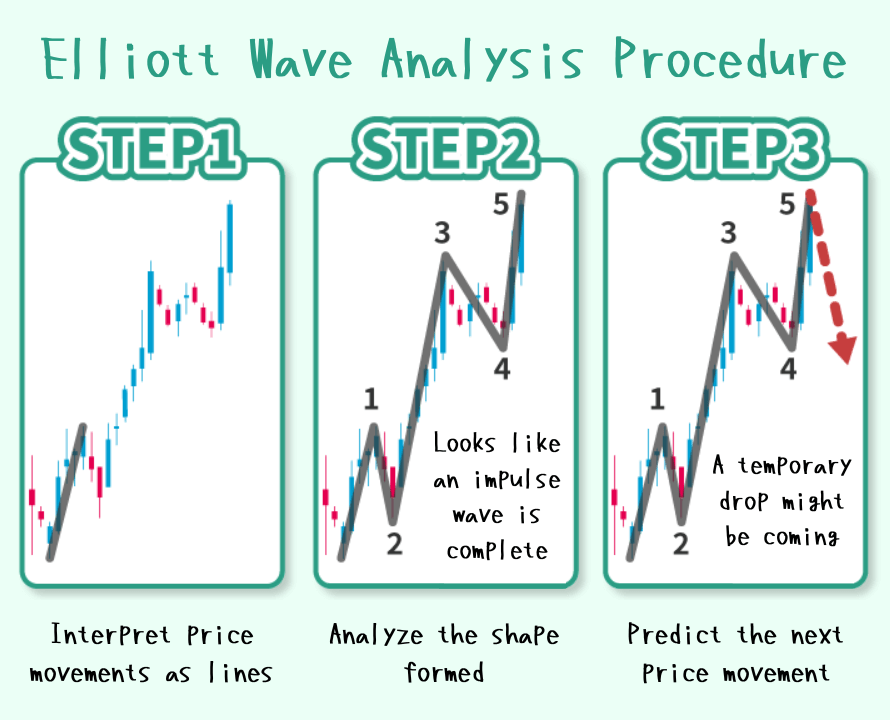
The basic process of analyzing with Elliott Wave Theory consists of the following three steps:
Draw lines connecting the start and end points of price movements (uptrends or downtrends) on the candlestick chart.
Fit the patterns formed by these lines to the “basic wave shapes.”
Predict the next price movement based on the characteristics of each “basic wave shape.”
As you can see, Elliott Wave analysis is made up of straightforward and simple steps.
Types of Elliott Waves
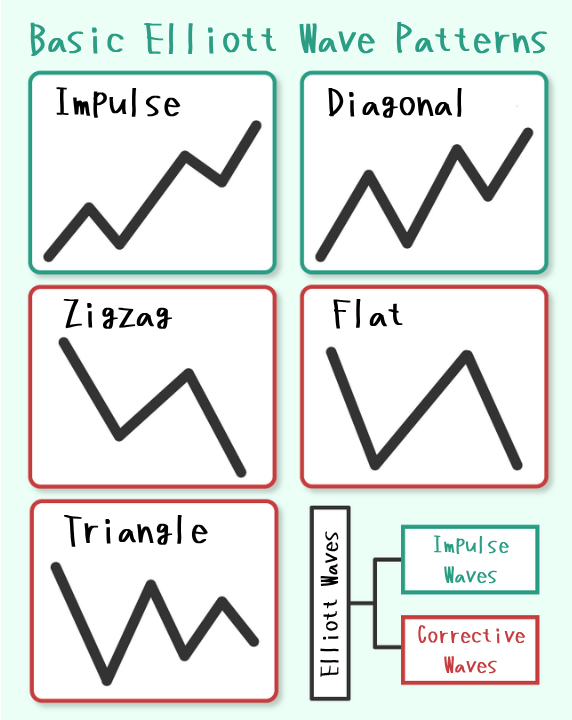
There are five “basic wave patterns” in Elliott Wave Theory.
Types of Basic Wave Patterns
In trending markets, the waves that appear are called “Impulse” and “Diagonal.”
In retracements or ranging markets, the waves that appear are “Zigzag,” “Flat,” and “Triangle.”
The characteristics of each basic wave pattern are explained in a separate article, so if you’re interested, please check out the related articles listed below!
Each of these wave patterns has characteristic price movements.
For example, an “Impulse” wave indicates a strong trend, while a “Zigzag” wave shows a sharp movement against the trend.
By understanding the market conditions indicated by each wave pattern,
With this wave pattern, there is a high probability that the next move will be upward.
Since that wave pattern has completed, there’s a high chance of a range breakout.
you can predict future price movements in the market.
Pattern analysis is simple and intuitive, making it easy for beginners to understand and apply.
Helps Build Scenario Predictions and Trading Strategies
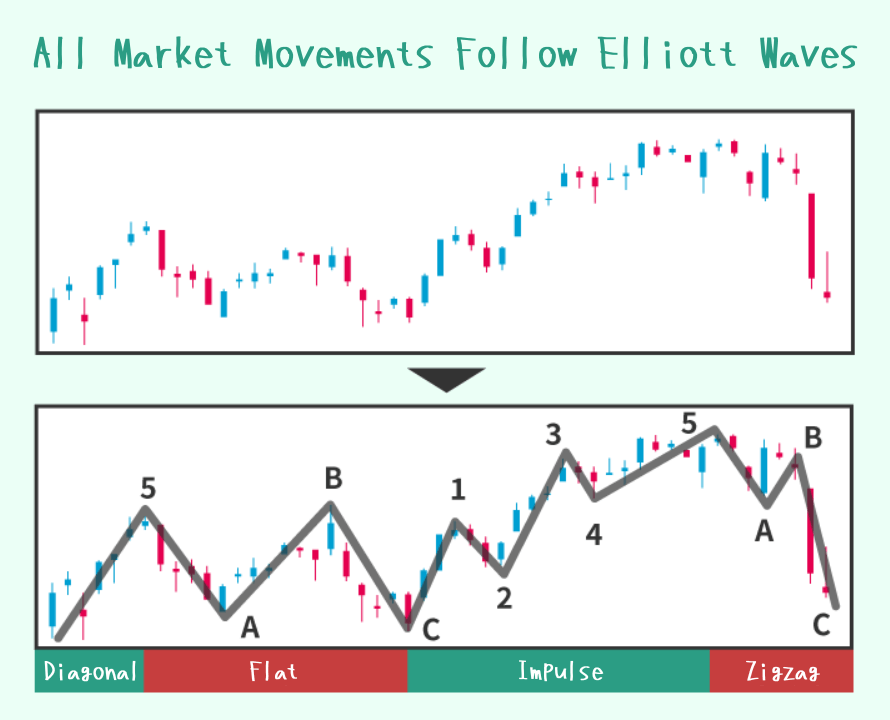
Elliott Wave Theory is based on the premise that all market movements are formed by Elliott Waves.
Each “basic wave pattern” also has its own characteristic price behavior.
By understanding these characteristics, you can forecast scenarios of how the market is likely to develop going forward.
For example, if it’s an “Impulse” wave, the price is likely to move strongly in the direction of the trend, like that.
Like…if it’s a “Flat” pattern, the price is likely to move back and forth between the recent highs and lows.
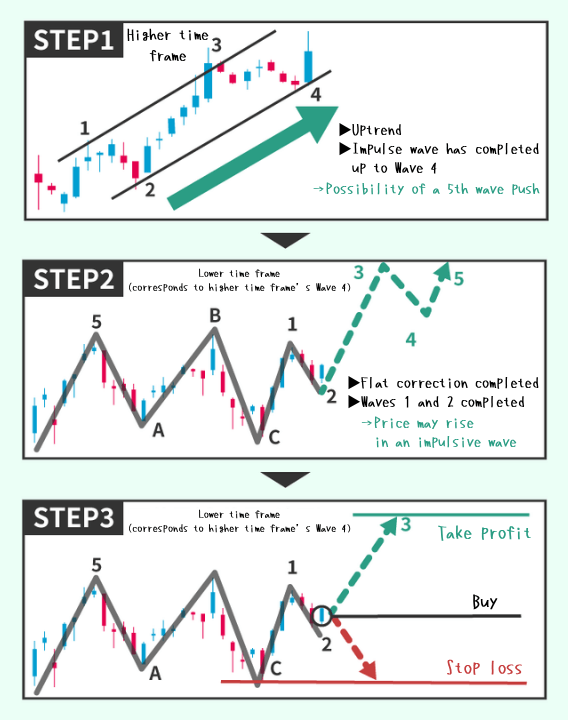
Example of a Trading Strategy Using Elliott Waves
STEP 1: Analyze the major trend direction and the wave pattern formed on the higher timeframe (longer-term chart).
STEP 2: On the lower timeframe (the chart you trade on), build a scenario based on the higher timeframe analysis by predicting “which basic wave the market is currently in” and “which wave is likely to appear next.”
STEP 3: Based on this scenario, set specific entry points and profit-taking levels to execute your trades.
By using Elliott Wave Theory in this way, you can forecast market movements and create trading strategies based on those predictions.
This allows you to manage investment risks while executing trades more efficiently.
Disadvantages and Cautions When Analyzing with Elliott Wave Theory
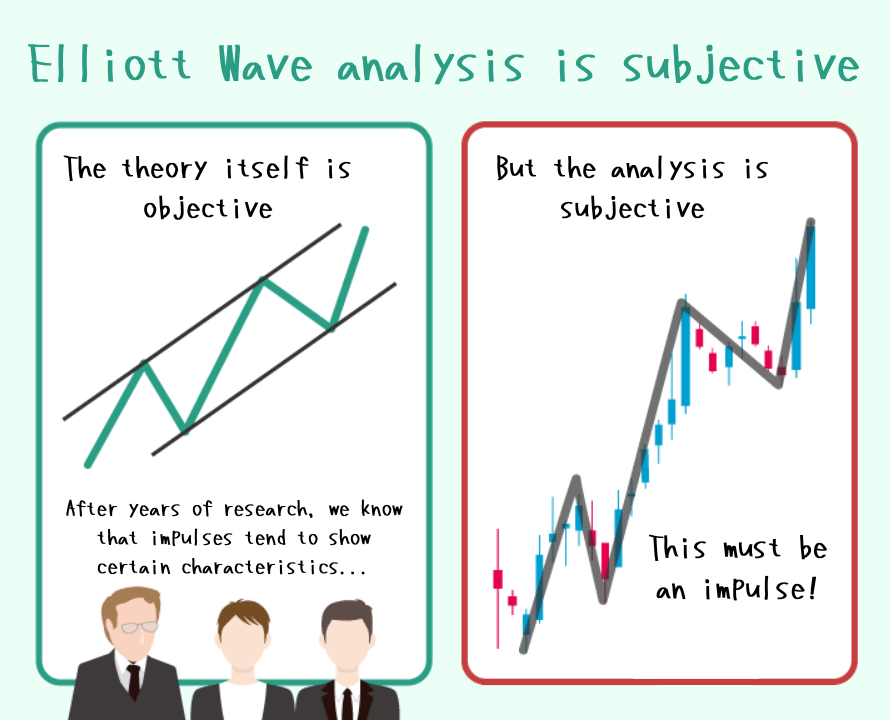
Pattern Fitting Is Subjective
Elliott Wave Theory is an objective technical analysis method built on years of accumulated experience and knowledge.
Each wave pattern has its own advantages when it comes to predicting market movements.
The Origin of Elliott Wave Theory
Ralph Nelson Elliott, a former accountant and investor, discovered recurring patterns in price movements.
He compiled his findings into a paper titled The Wave Principle.
After Elliott’s death, Hamilton Bolton and Robert Prechter took interest in his work and expanded upon it with additional insights and revisions.
This led to the development of what is now known as modern Elliott Wave Theory.
However, the decision of “which Elliott Wave pattern to apply to the market” is ultimately a subjective judgment.
Even if you’re convinced that “this must be the correct wave pattern,” it is still just your personal interpretation.
It’s important to understand that the market doesn’t always move according to your expectations.
You can trust in the existence of Elliott Waves themselves, but it’s also important to question your own interpretation when applying them!
It’s important to stay aware that “this is simply how you are viewing the market.”
When analyzing the market using Elliott Wave Theory, overestimating your understanding can lead to a bias toward counter-trend thinking.
This carries the risk of becoming fixated on your own view and failing to recognize the possibility that your market analysis may be incorrect.
Therefore, it’s essential to approach Elliott Wave analysis with the mindset that it is a subjective interpretation.
It’s also important to develop multiple possible scenarios whenever you can, and avoid getting attached to just one.
If your trades start going well and you find yourself thinking, “Maybe I’m a genius,” that’s exactly when you need to be extra careful.
Exactly! Personally, I recommend getting into the habit of considering all three scenarios—bullish, sideways, and bearish— and then assessing which one has the highest probability.
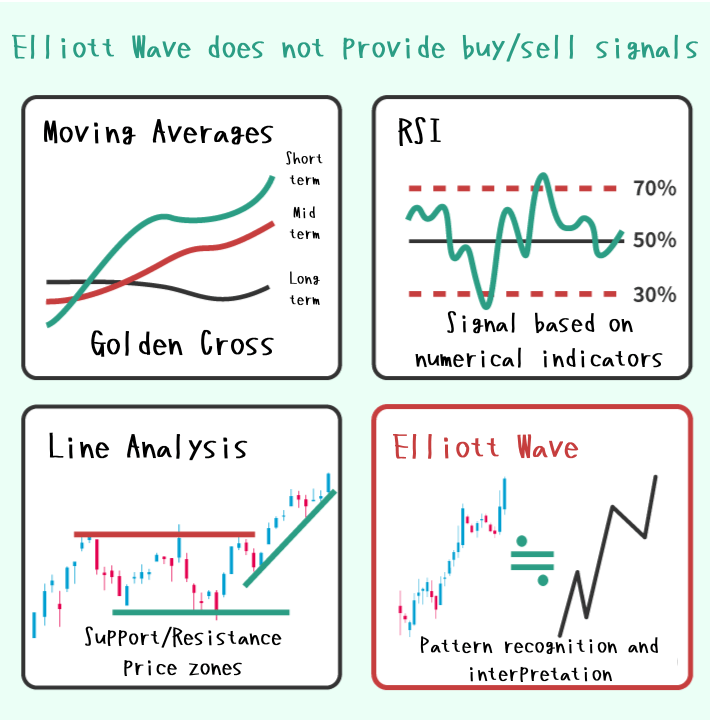
Not a Clear Buy or Sell Signal
It’s important to understand that Elliott Wave Theory is a technical tool for developing a correct market perspective.
While Elliott Wave analysis allows you to create scenarios like “if this wave pattern appears, then take this action,”
it does not provide clear buy or sell signals like a moving average golden cross or dead cross, or numerical indicators such as RSI showing overbought or oversold conditions.
For this reason, Elliott Wave Theory is not suited for mechanical or rule-based trading systems.
Signal Type
Buy Signal
Sell Signal
Moving Average
Golden Cross
Dead Cross
RSI
Oversold (30%)
Overbought (70%)
Line Analysis
Resistance
Support
Elliott Wave
Personal Judgment
Personal Judgment
So, Elliott Wave Theory can’t give you clear buy or sell points like “sell at this price” or “buy at that price.”
Exactly. But it’s very useful for analyzing the overall market picture and forecasting future scenarios!
Relying solely on Elliott Wave Theory for trading tends to lead to subjective judgments.
In actual trading, it’s important to combine it with other technical tools.
Use Elliott Wave analysis to form a market outlook, then confirm objective buy or sell signals with other technical indicators before making your trades.
The author combines tools like line analysis, simple moving averages, and Dow Theory to make comprehensive trading decisions.
Summary
Just as there is no holy grail in Forex or investing, mastering Elliott Wave Theory does not guarantee you’ll never lose.
Elliott Wave Theory is just one method of technical analysis—a single perspective for viewing the market.
It’s important to be aware that every method and technical tool has its strengths and weaknesses, and to use them in a well-balanced combination.
The benefits of analyzing with Elliott Wave Theory are:
①Useful for multi-timeframe analysis ②Simple analysis by fitting patterns ③Helpful for scenario forecasting and strategy building
As for cautions:
①Elliott Wave analysis is subjective ②It does not provide clear buy or sell signals
This blog summarizes the basic knowledge of Elliott Wave Theory, so if you’re interested, please check out our other related articles!