
USDJPY Market Analysis and Trading Strategies.
*Personal Opinion
I use “XMTRADING” as my trading tool.

It is my personal most trusted trading account and is used by many professional traders.
I use “TradingView” as my analysis tool.
Registering an account gives you access to many features for free.
Waveforms of each time leg
Weekly
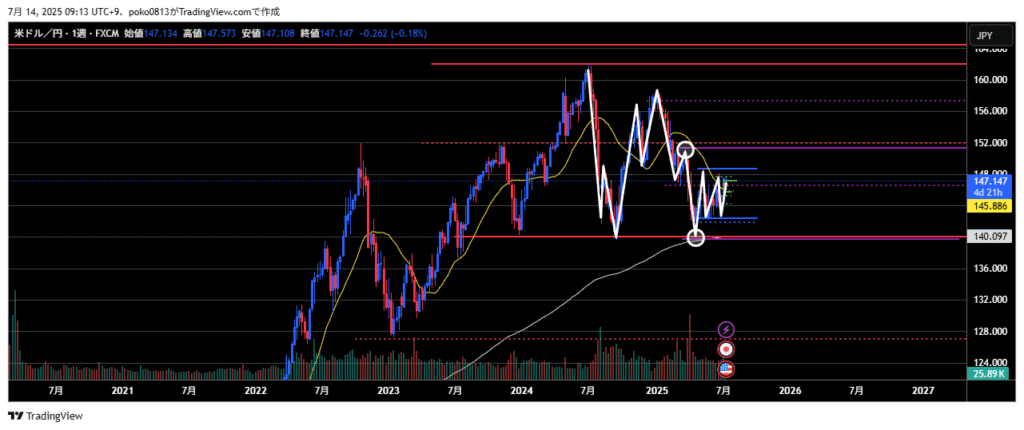
The origin of the most recent low has not yet been broken to the upside, so the downtrend is still intact for now.
Currently, the market is moving sideways on the lower timeframes.
Daily
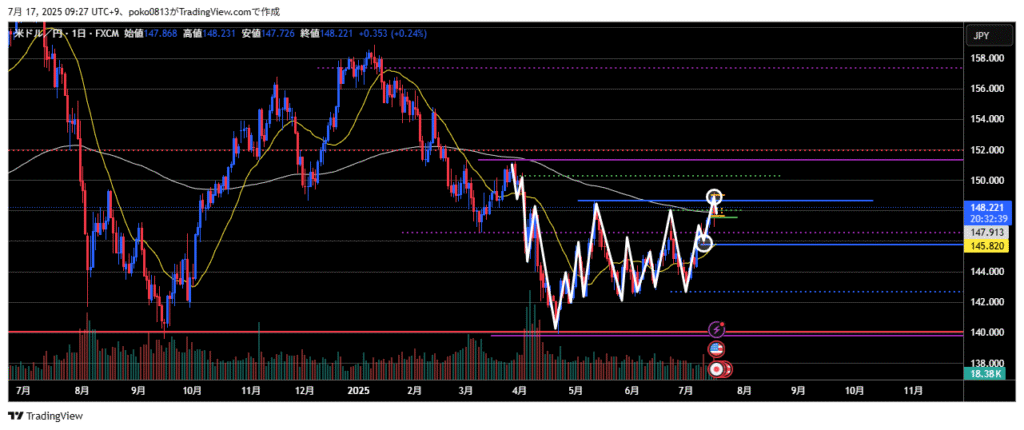
The price had been ranging between 142.3 yen and 148.5 yen, but that range has now been broken to the upside.
With this breakout, buying holds a higher probability in the medium to long term, at least until the final swing high level on the weekly chart is reached.
4-Hour
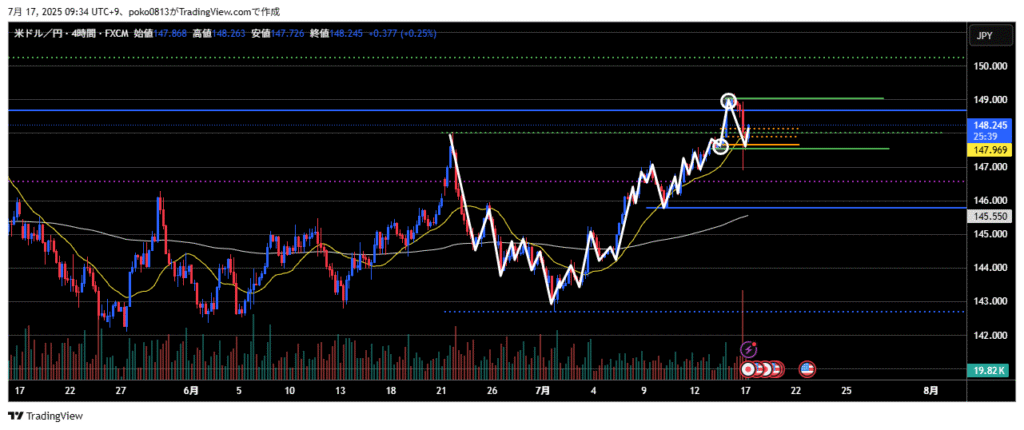
There was a temporary spike in price movement yesterday due to reports of Fed Chair Powell’s resignation and comments from President Trump denying it.
The last swing low on the 4-hour chart was broken by a candlestick wick, but not by the body, so the bullish outlook remains intact.
1-Hour
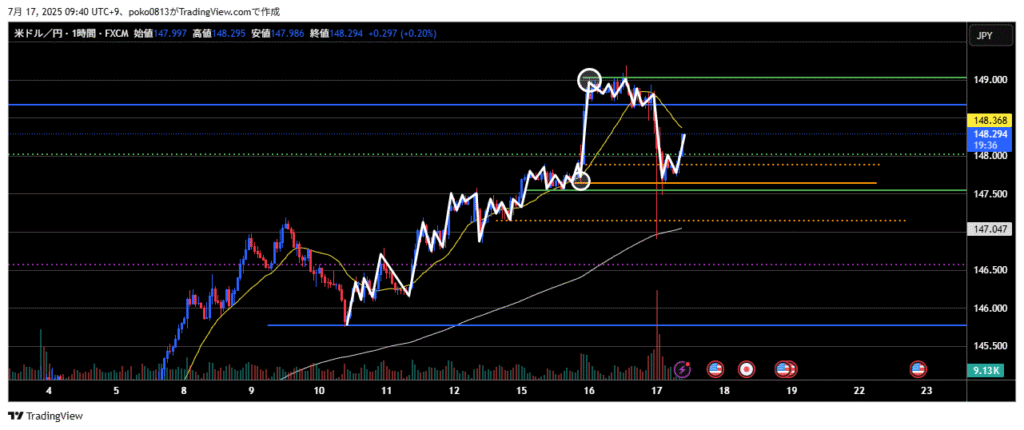
Just like on the 4-hour chart, the last swing low has not been broken by the candlestick body, so the bullish outlook continues on the 1-hour chart as well.
It’s unclear whether the technicals are holding, but the price is rising after forming a double bottom around the swing low zone.
Trade Strategies
There are several important economic indicators being released today, so please stay alert.
For details, refer to the Economic Calendar on TradingView.
Note: Make sure to adjust for each country’s time zone.
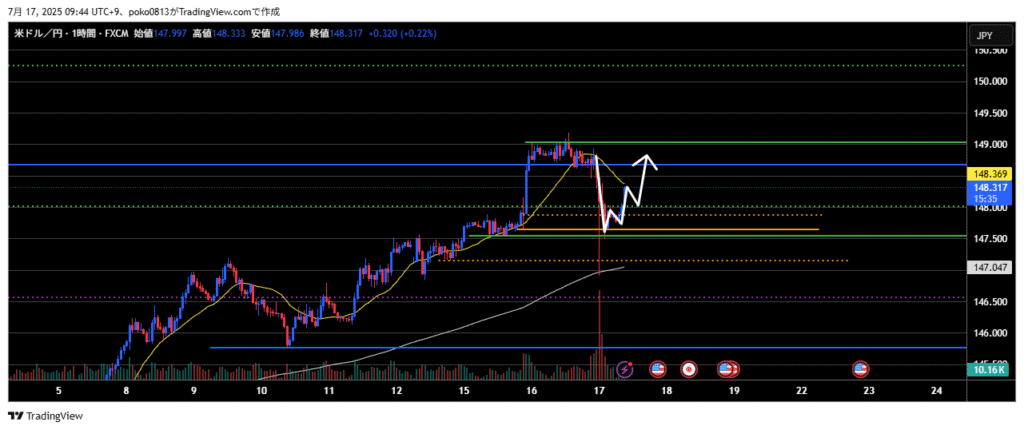
Viewing the chart as a double bottom at the swing low line on the 1-hour chart, consider a long entry when the price pulls back near the neckline.
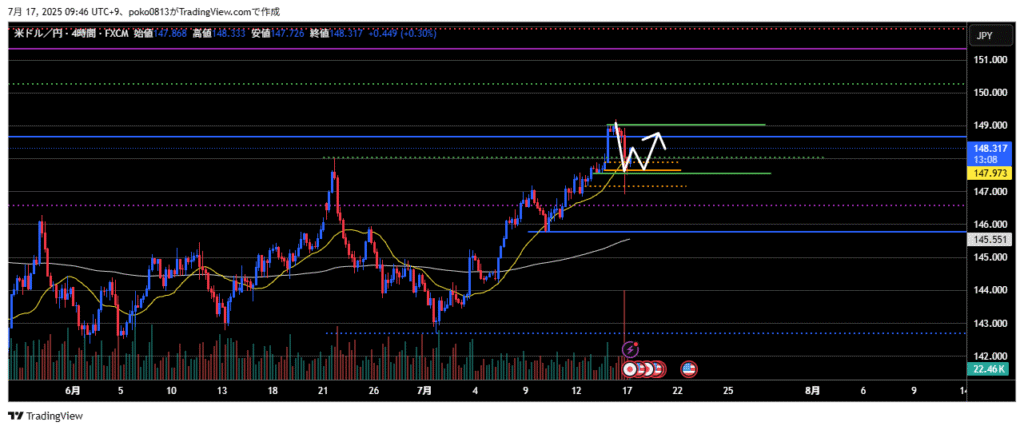
There is also a possibility of a larger double bottom forming at the swing low line on the 4-hour chart.
In that case as well, consider a long entry.
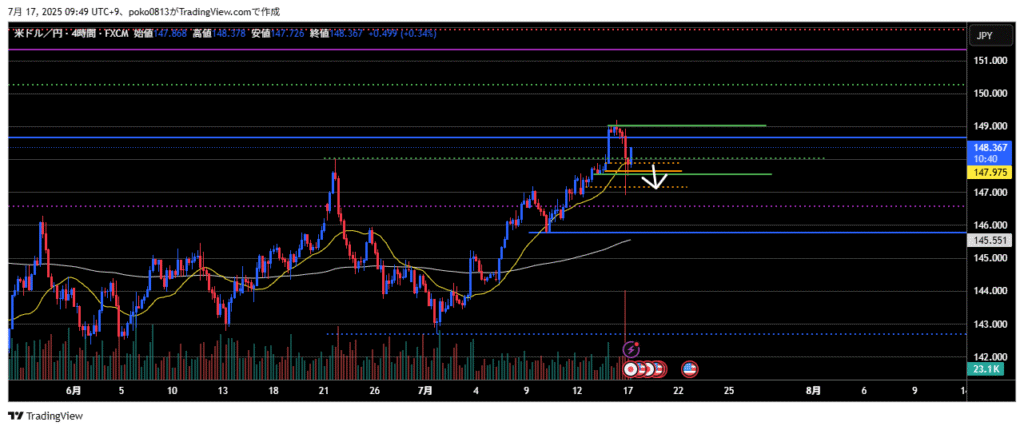
If the swing low line on the 4-hour chart is clearly broken by the candlestick body, the long strategy will be scrapped.