
USDJPY Market Analysis and Trading Strategies.
*Personal Opinion
I use “XMTRADING” as my trading tool.

It is my personal most trusted trading account and is used by many professional traders.
I use “TradingView” as my analysis tool.
Registering an account gives you access to many features for free.
Waveforms of each time leg
Weekly
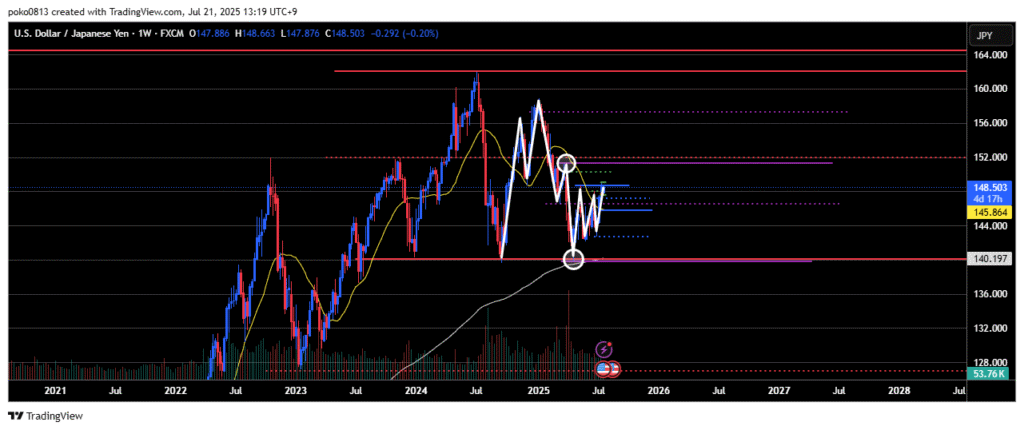
The market is in a downtrend.
From an Elliott Wave perspective, it appears to be in the 4th or 5th wave of the decline, but there’s a possibility that the wave sequence has already completed.
While the weekly chart still suggests a bearish outlook, lower timeframes are showing strong bullish bias, and the price may continue rising toward the final swing high level on the weekly chart.
Daily
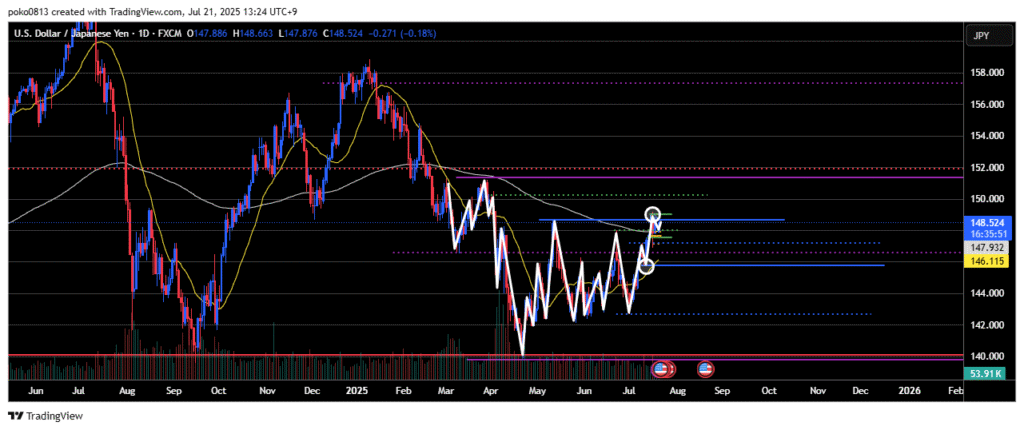
The 148.64 yen level has been broken to the upside with a candlestick body close above it.
Currently, the last confirmed swing low is considered to be at 145.75 yen.
The market is forming higher highs and higher lows, indicating an ongoing uptrend, and it now appears to be entering a correction phase.
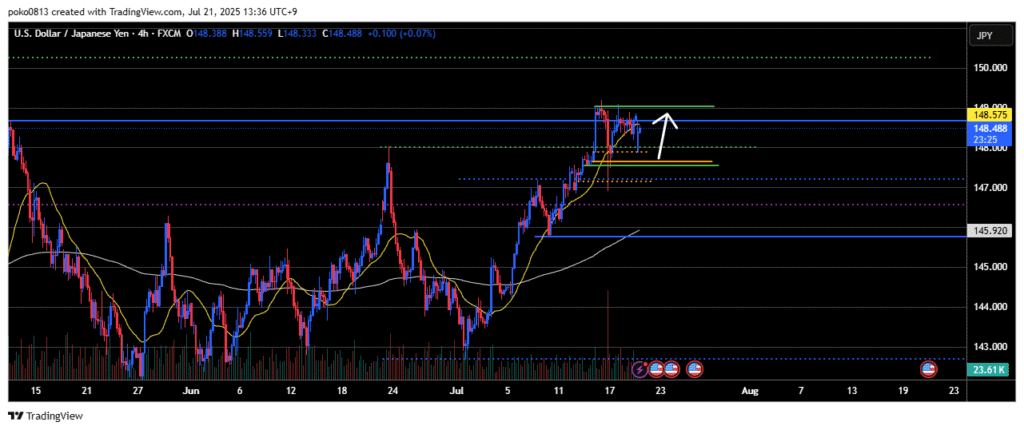
4-Hour
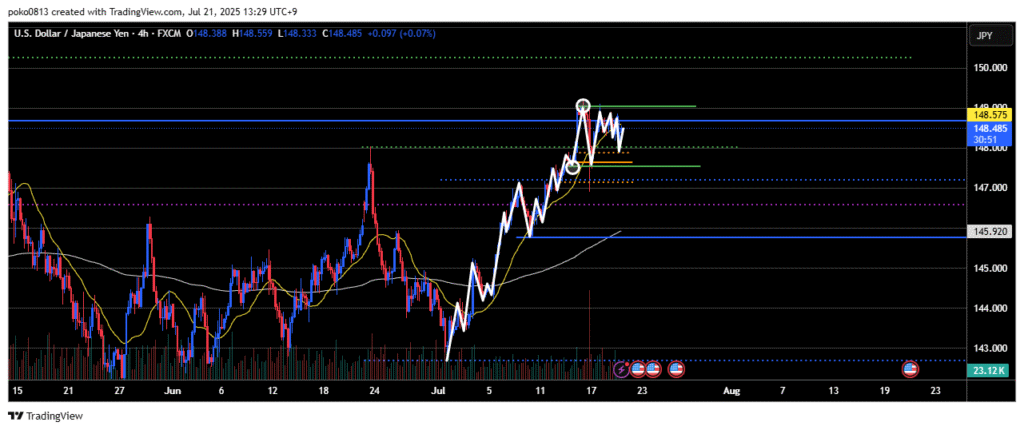
The market is in an uptrend.
The last swing low was briefly broken by a candlestick wick, but not by the body, so the bullish outlook remains intact.
Price is currently moving within a range between the recent high and its origin.
1-Hour
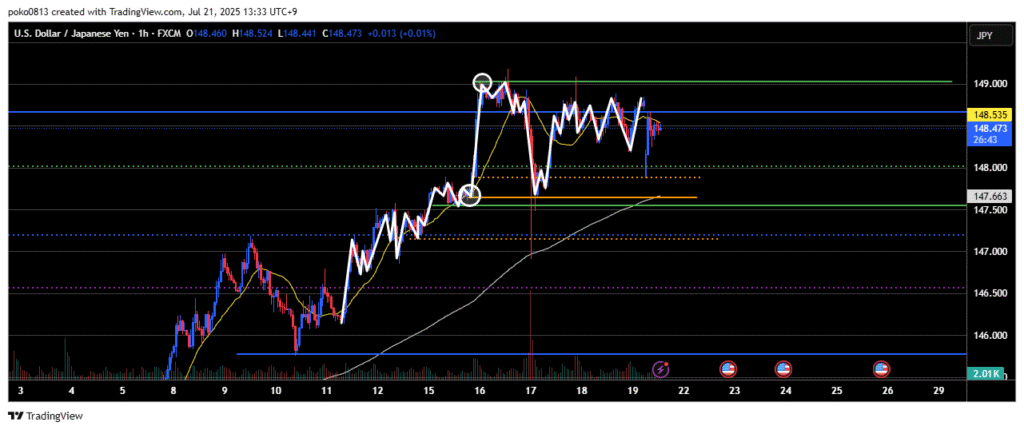
Due to the temporary volatility caused by the controversy surrounding Chair Powell’s possible dismissal, the price has been fluctuating within a range roughly equal to the 4-hour chart’s recent price swing.
The new week began with a gap of about 80 pips.
Trade Strategies
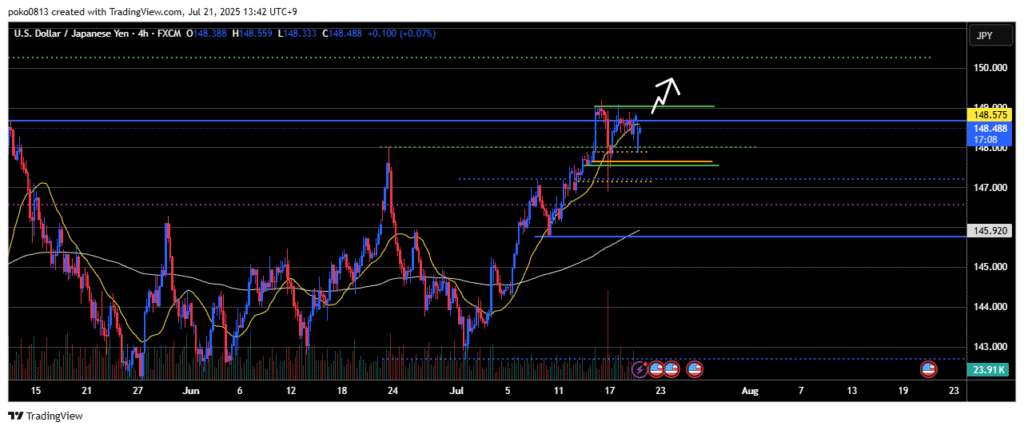
In trades based on the 1-hour and 4-hour charts, pullback buying still offers higher probability.
As long as the last swing low on the 4-hour chart isn’t clearly broken, the market remains favorable for buying on dips.
If the price pulls back to that level, close attention should be paid to the price action for potential entry signals.
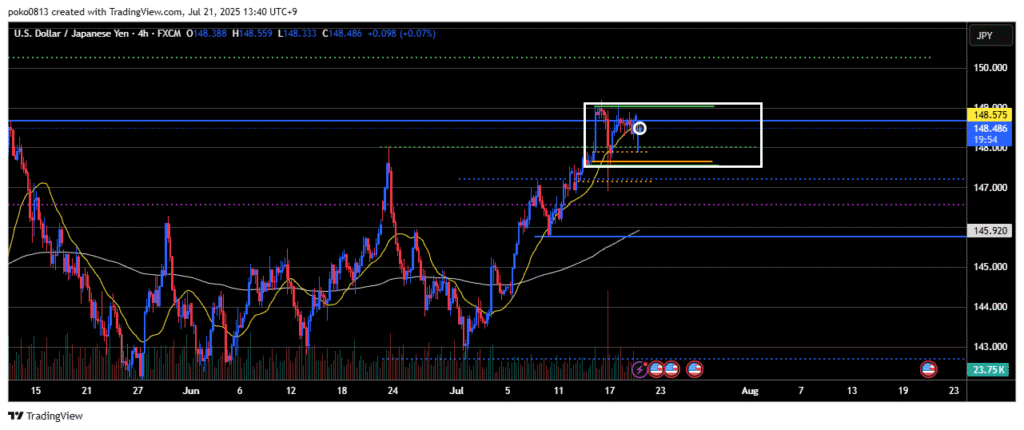
The price is currently around the middle of the range shown in the image, which may lead to a lack of clear direction.
Unless the goal is scalping, trading at the current price level carries higher risk and should be approached with caution.
If the price breaks above the upper boundary of the range, I’d be looking to enter on a pullback buy using lower timeframes.
Update
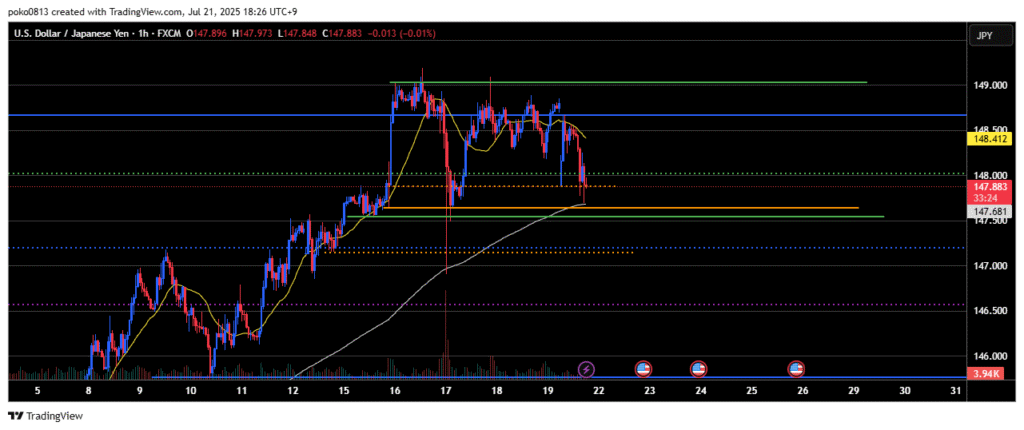
The price has pulled back to the targeted zone.
I’m looking to time a long entry using the lower timeframes.
However, the short-term bearish momentum still appears to be fairly strong, so caution is needed when gauging entry timing.
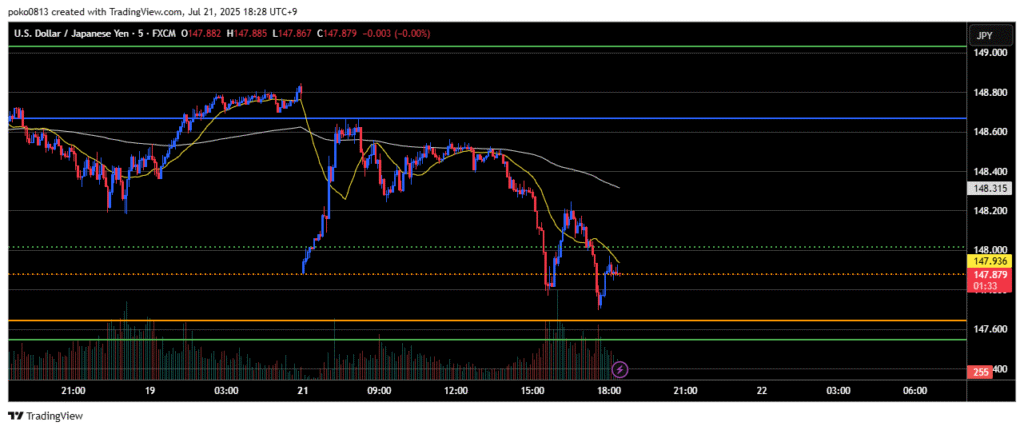
On the 5-minute chart, the current structure still shows a bearish outlook.
I’d prefer to enter either when the bias shifts upward or when the chart starts forming higher highs and higher lows.
The stop-loss will be placed at the point where the entry rationale is invalidated.
Update 2
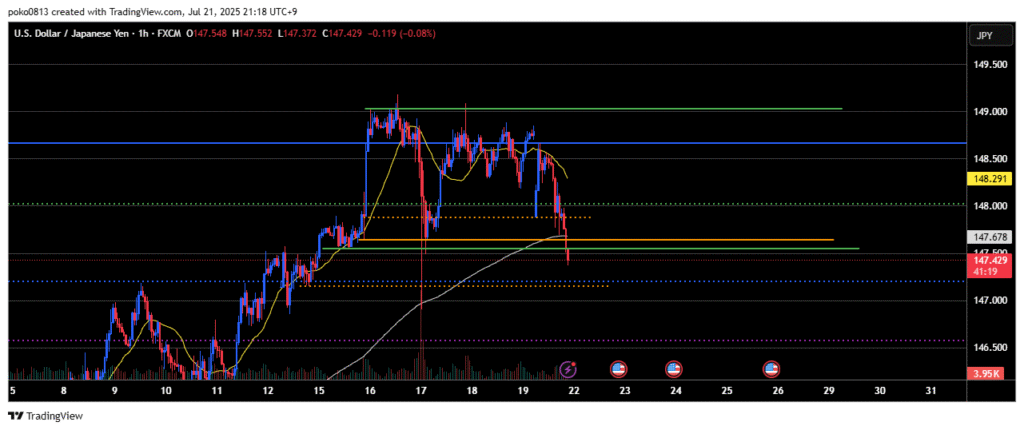
With 40 minutes left until the 1-hour and 4-hour candles close, it’s looking a bit too early to consider a buy entry at this point.
From my perspective, the 1-hour chart has shifted to a bearish outlook.
It’s now a matter of watching whether the upward bias on the daily timeframe can overpower the short-term downward momentum.
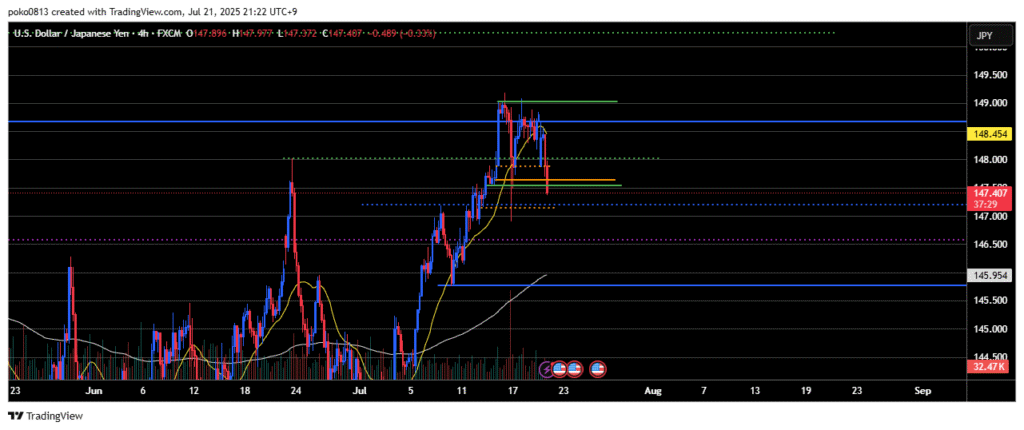
If the 4-hour candle gets pulled back by a wick and does not close below the key level with its body, I’ll consider a buy entry.