USDJPY Market Analysis and Trading Strategies.
*Personal Opinion
I use “XMTRADING” as my trading tool.

It is my personal most trusted trading account and is used by many professional traders.
I use “TradingView” as my analysis tool.
Registering an account gives you access to many features for free.
Waveforms of each time leg
Weekly
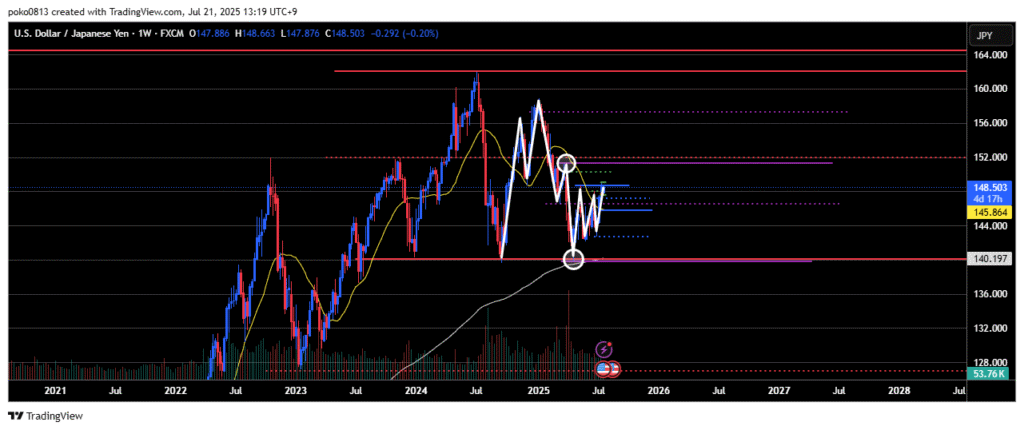
The market is in a downtrend.
From an Elliott Wave perspective, it appears to be in the 4th or 5th wave of the decline, but there’s a possibility that the wave sequence has already completed.
While the weekly chart still suggests a bearish outlook, lower timeframes are showing strong bullish bias, and the price may continue rising toward the final swing high level on the weekly chart.
Daily
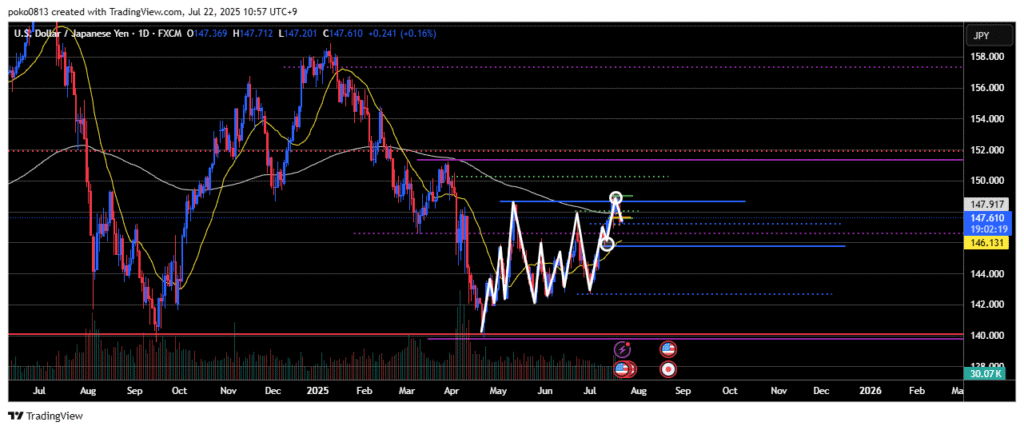
The 148.64 yen level has been broken to the upside with a candlestick body close above it.
Currently, the last confirmed swing low is considered to be at 145.75 yen.
The market is forming higher highs and higher lows, indicating an ongoing uptrend, and it now appears to be entering a correction phase.
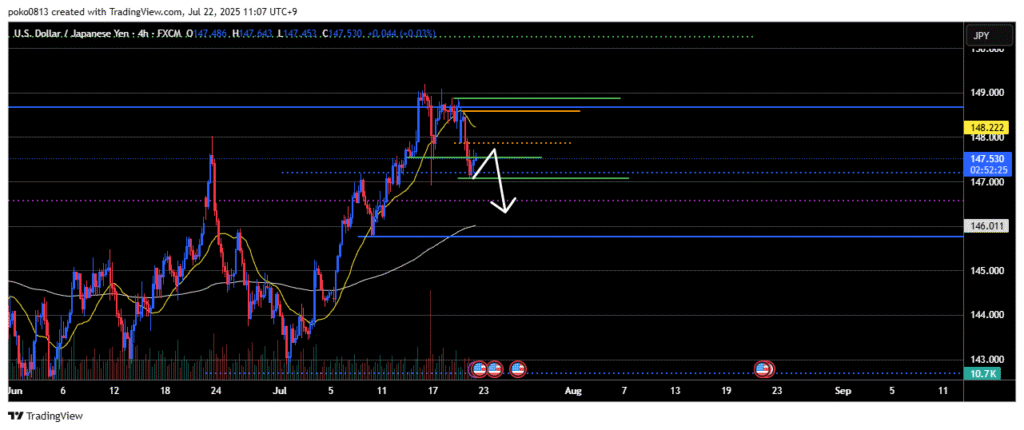
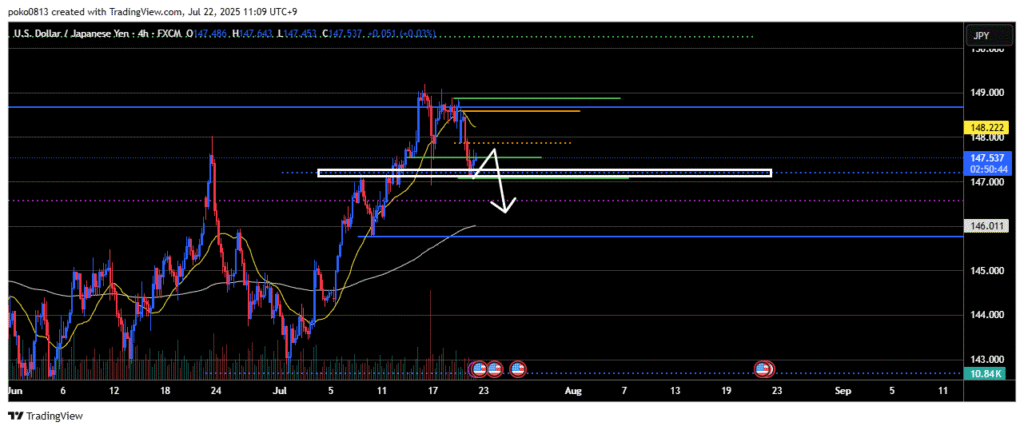
4-Hour
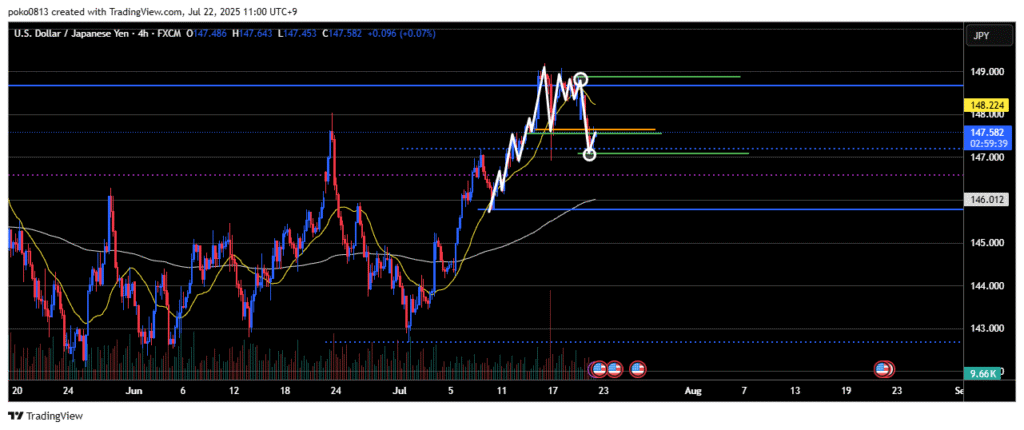
The last swing low has been broken to the downside, shifting the outlook to bearish.
The price is currently retracing upward toward the previous swing low level.
The key now is whether this area acts as a resistance-turned-support zone, or if the market needs a bit more time for further price adjustment.
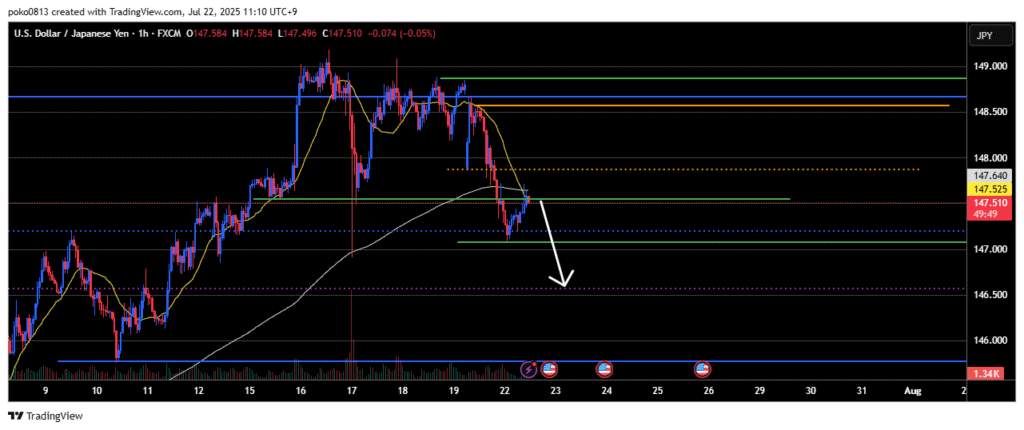
1-Hour
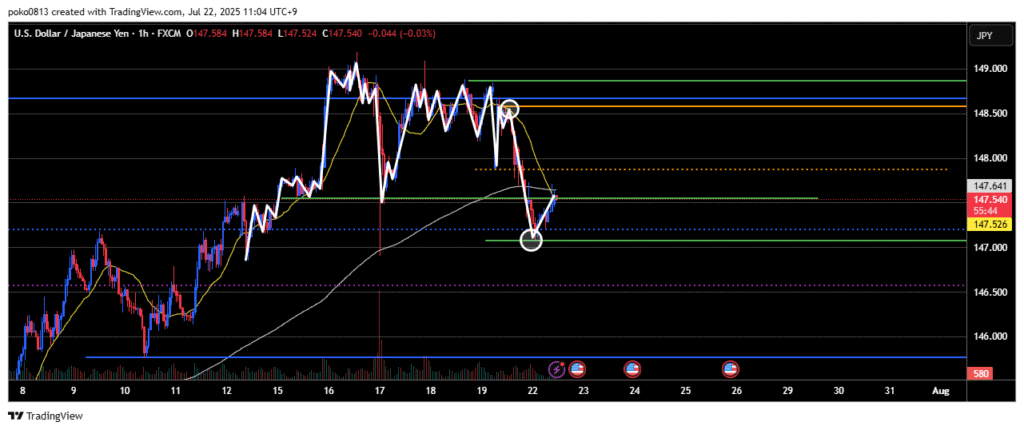
A significant drop has occurred, shifting the outlook to bearish in line with the 4-hour chart.
Currently, signs of a pullback sell are appearing around the 1-hour 21-period moving average and the resistance-turned-support level on the 4-hour chart.
Trade Strategies
Consider waiting for the price to pull back near the 21-period moving average on the 4-hour chart before looking for a short entry opportunity.
However, be cautious, as there is a possibility that buying pressure could emerge around the previous high on the daily chart, acting as a pullback support level.
Selling pressure is visible on the 1-hour chart, so consider a short entry once the bias shifts downward on the lower timeframes.