
USDJPY Market Analysis and Trading Strategies.
*Personal Opinion
I use “XMTRADING” as my trading tool.

It is my personal most trusted trading account and is used by many professional traders.
I use “TradingView” as my analysis tool.
Registering an account gives you access to many features for free.
Waveforms of each time leg
Weekly
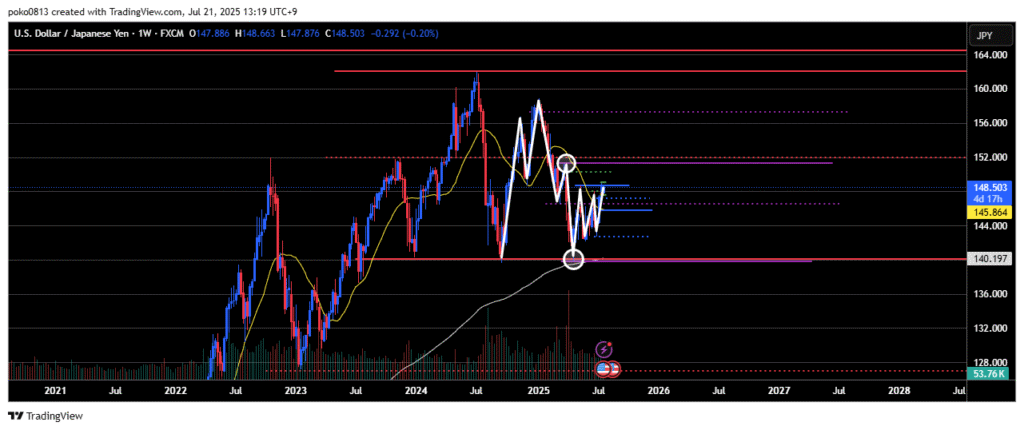
The market is in a downtrend.
From an Elliott Wave perspective, it appears to be in the 4th or 5th wave of the decline, but there’s a possibility that the wave sequence has already completed.
While the weekly chart still suggests a bearish outlook, lower timeframes are showing strong bullish bias, and the price may continue rising toward the final swing high level on the weekly chart.
Daily
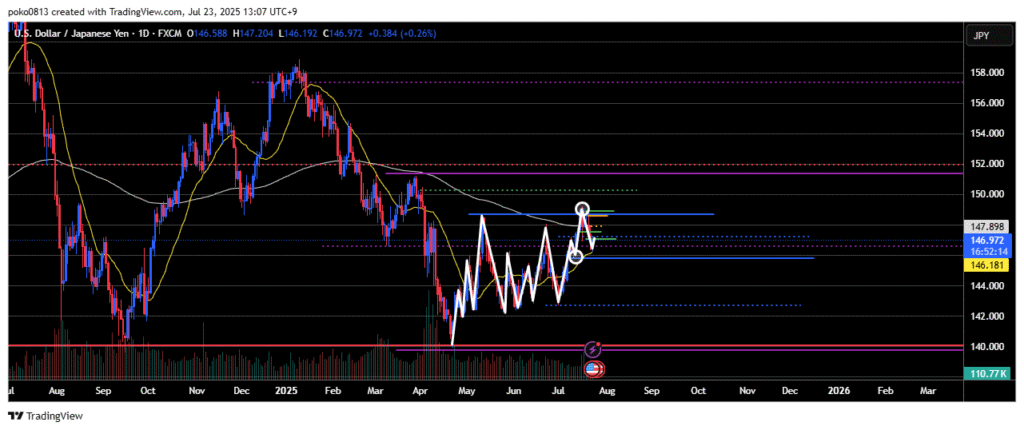
The 148.64 yen level has been broken to the upside with a candlestick body close above it.
Currently, the last confirmed swing low is considered to be at 145.75 yen.
The market is forming higher highs and higher lows, indicating an ongoing uptrend, and it now appears to be entering a correction phase.
Price has broken below the previous high line and is currently declining toward the last significant swing low area.
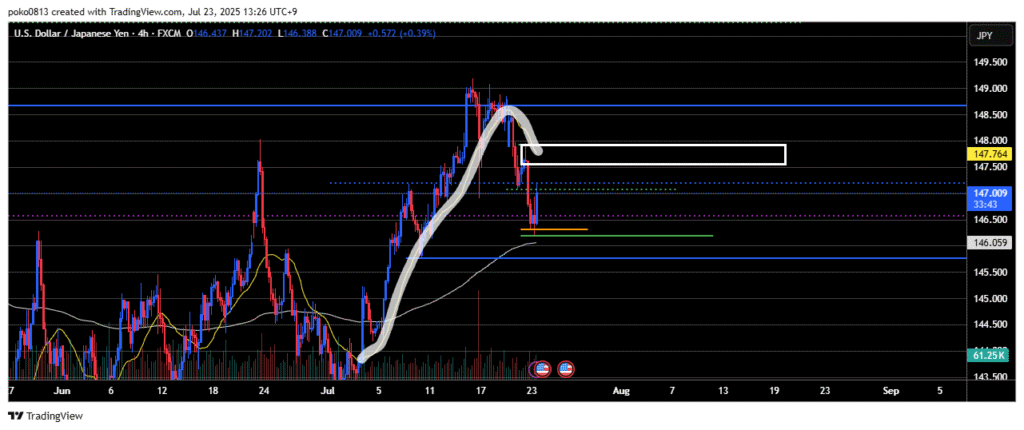
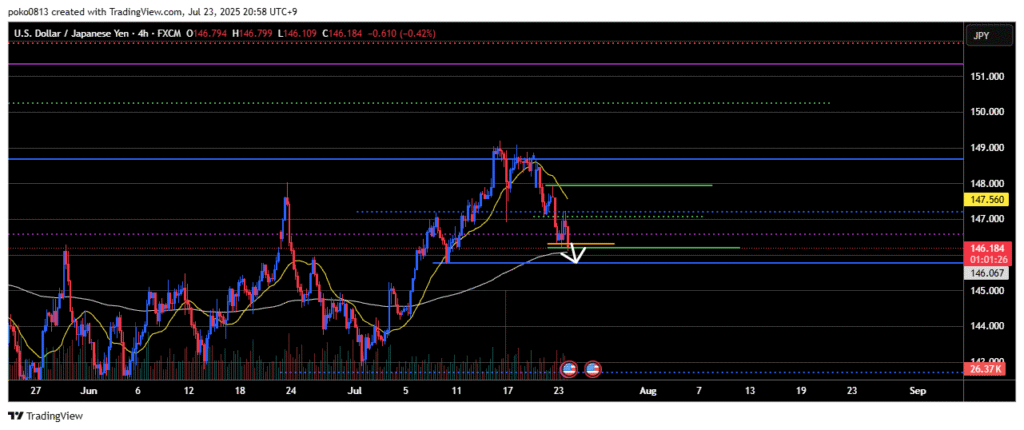
4-Hour
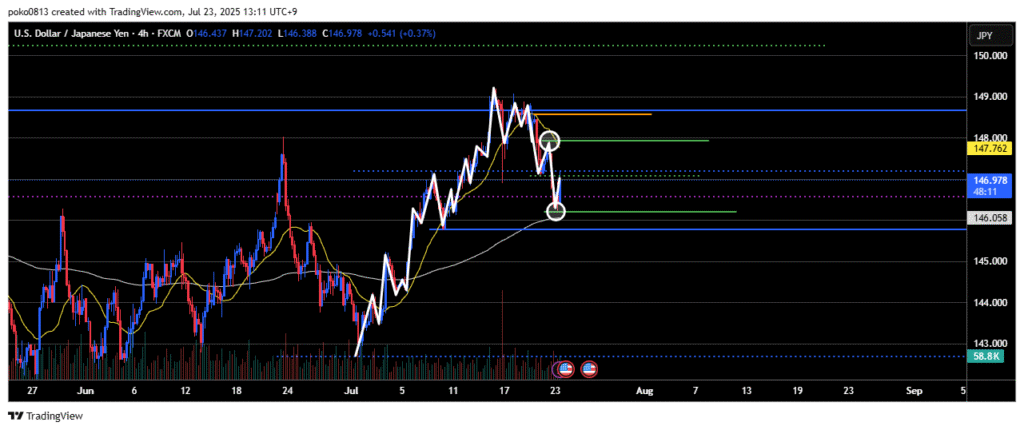
The trend has shifted from an uptrend to a downtrend.
Currently, I recognize this as the 4th wave of a downward Elliott Wave pattern.
It’s uncertain whether the 5th wave down will follow or if the price will reverse upward from here, but if the 4-hour chart is used as the reference timeframe, a pullback sell setup offers a higher expected value.
The price is currently significantly deviated from the 21-period moving average.
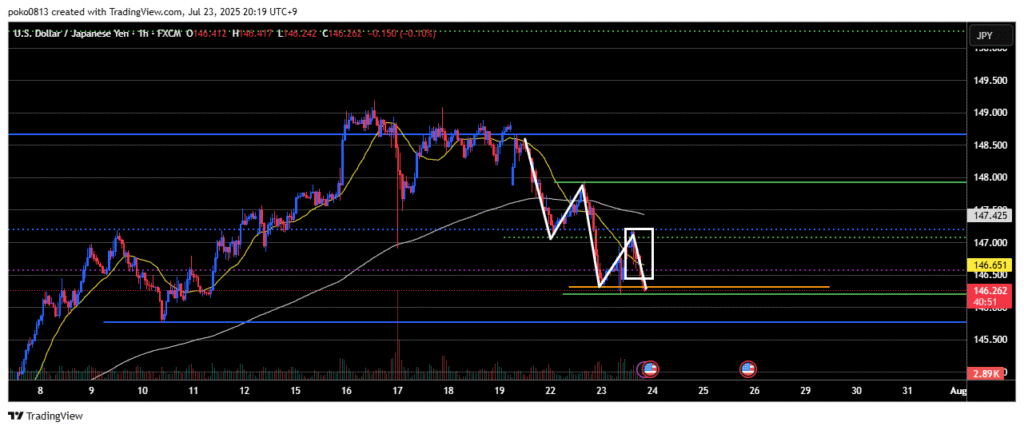
1-Hour
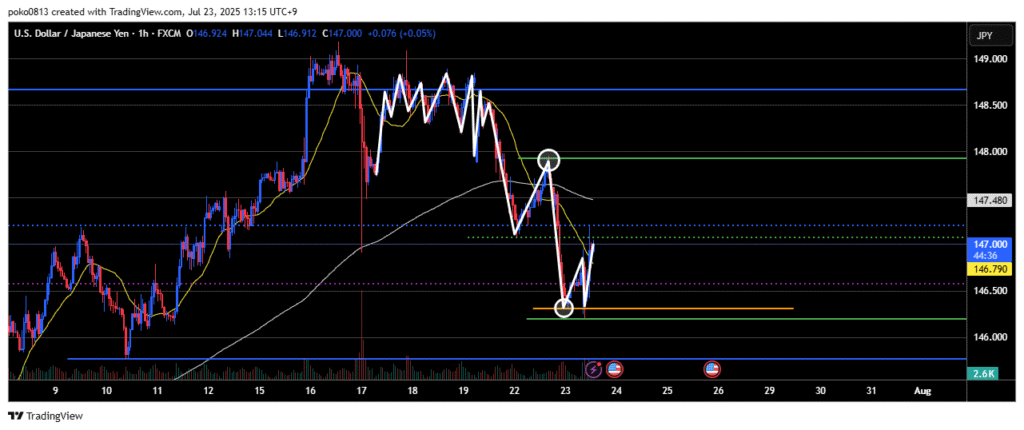
A downtrend is forming with a wave pattern that closely mirrors that of the 4-hour chart.
Selling pressure emerged near the 21-period moving average, causing a temporary decline, but the recent low was not broken in terms of candle bodies, and the price is now rebounding upward.
Trade Strategies
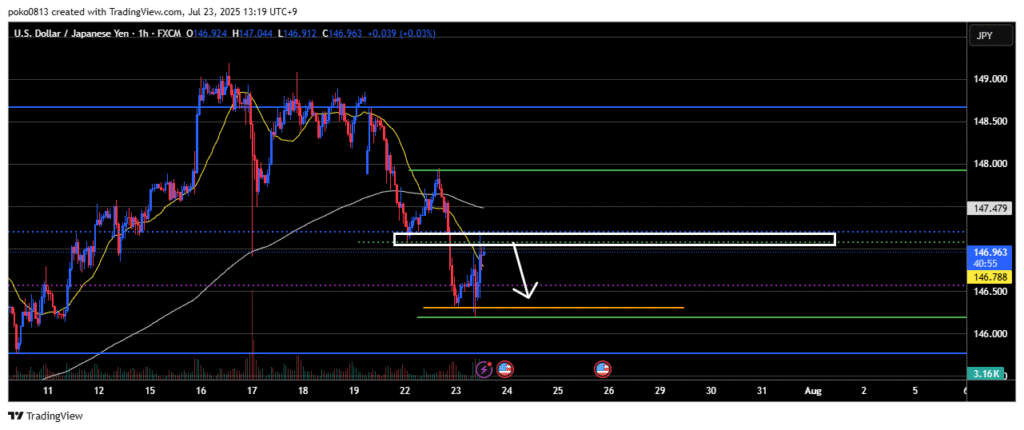
Currently considering a short entry targeting the 5th wave of the Elliott Wave pattern from the current price zone.
The presence of upper wicks on the candlesticks indicates a certain level of selling pressure, but the continued slight upward movement suggests that buying momentum remains strong in the short term.
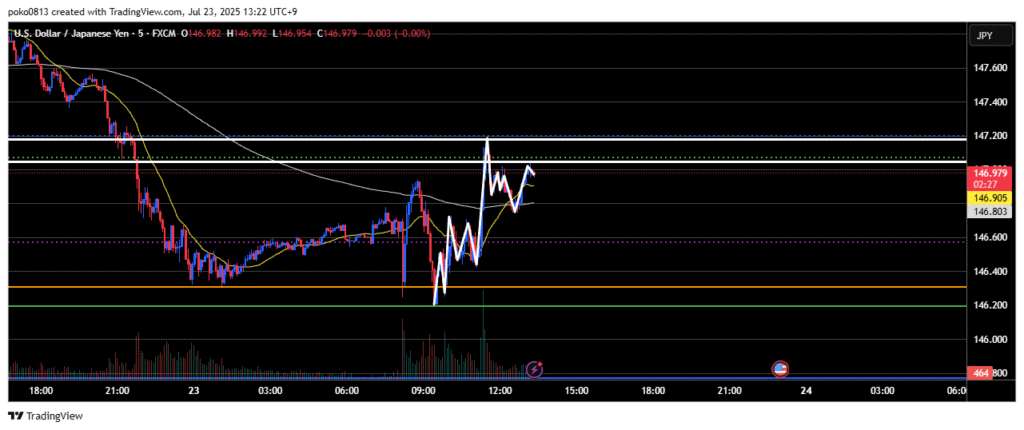
The 5-minute chart is currently in an uptrend, with the most recent swing low positioned quite far below the current price.
Waiting for a break below that swing low would result in a poor risk-to-reward ratio, making entry difficult.
If the 5-minute chart forms a new high once more, it could create a more favorable setup for a trade.
However, caution is needed as short-term buying pressure may continue to strengthen.
There is also a possibility that the price may retrace up to the 21-period moving average on the 4-hour chart or the area around the most recent swing high.
Update
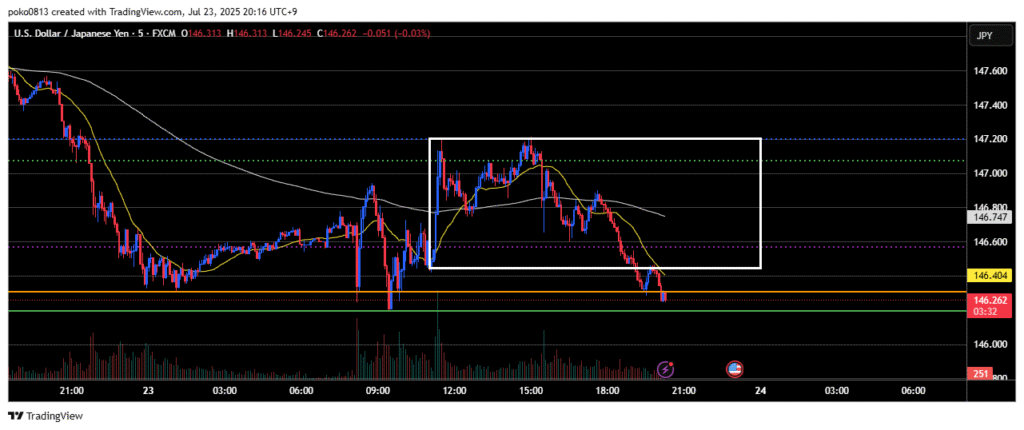
On the 5-minute chart, the price failed to break the high and dropped below the range support.
I was considering an entry if the price broke the high and formed a new pullback, but the chart didn’t develop as expected.
It looks like the fifth wave of the downtrend has played out after all.
At this point, it’s not a good idea to enter a short position.
Time to plan the next strategy.
Update2
If the recent low is broken on the 4-hour chart, there might be an opportunity to target the daily swing low area using lower timeframes.
It’s a bit risky, though.