
USDJPY Market Analysis and Trading Strategies.
*Personal Opinion
I use “XMTRADING” as my trading tool.

It is my personal most trusted trading account and is used by many professional traders.
I use “TradingView” as my analysis tool.
Registering an account gives you access to many features for free.
Waveforms of each time leg
Weekly
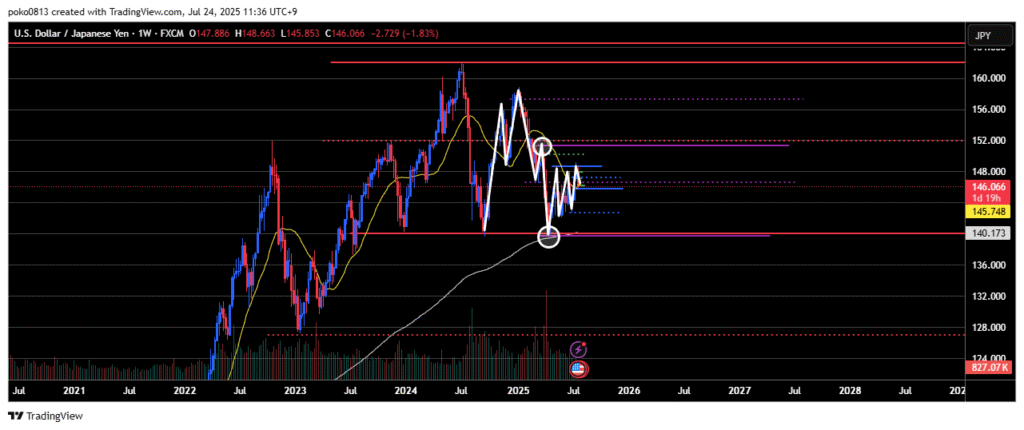
The market is in a downtrend.
There appears to be strong upward pressure on the lower timeframes, but unless the most recent swing high is clearly broken, the overall bias on the weekly chart remains bearish.
It still seems likely that the price could reach the 150 yen level.
Daily
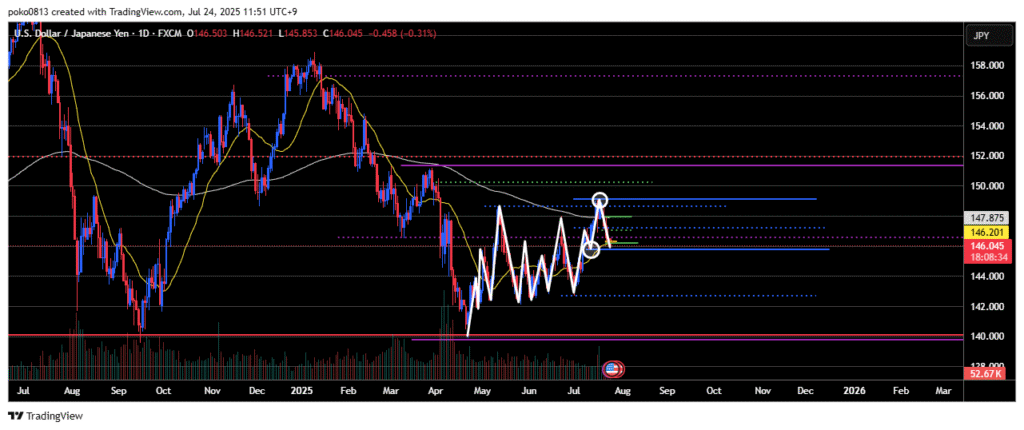
The 148.64 yen level has been broken to the upside with a candlestick body close above it.
Currently, the last confirmed swing low is considered to be at 145.75 yen.
A significant price correction has taken place, and the market has pulled back close to the last swing low.
From here, the question is whether buying pressure will increase and push the price higher, or whether selling pressure will prevail and drive the price further downward.
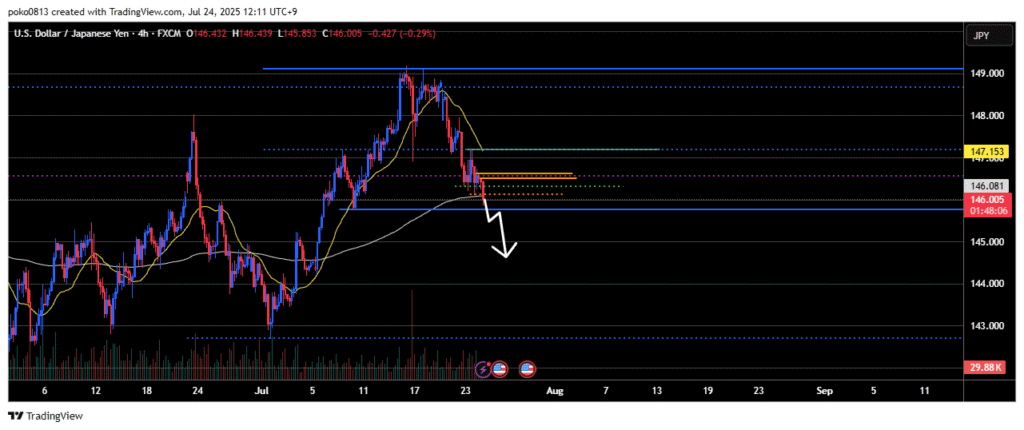
4-Hour
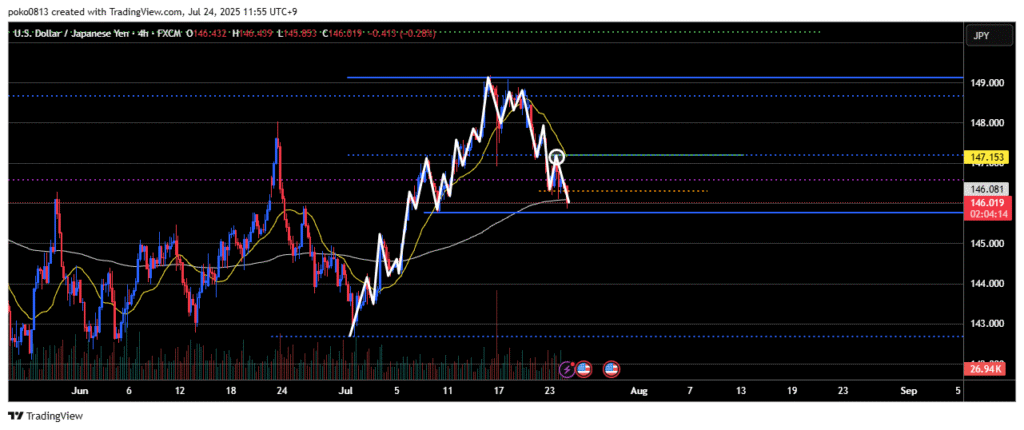
A downtrend is in place.
This appears to be the 5th wave of the Elliott Wave pattern.
If the price breaks below a key horizontal support level on the daily chart, the downward momentum could significantly accelerate.
1-Hour
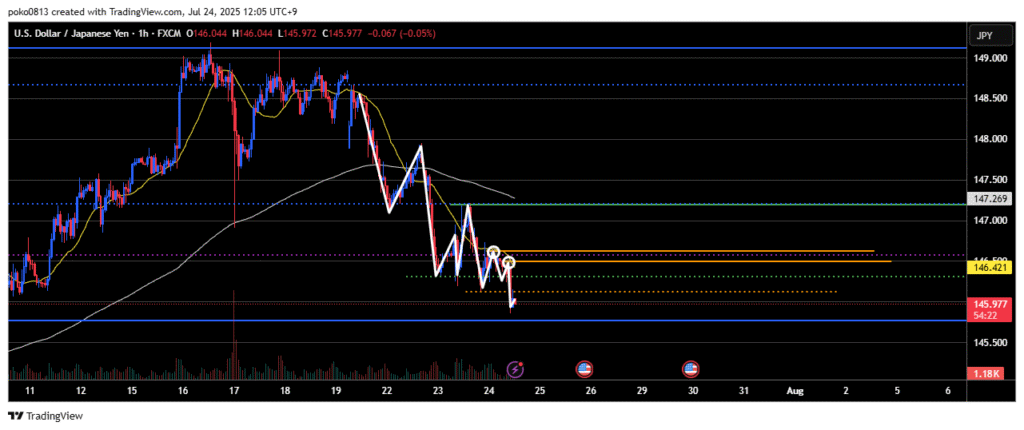
A downtrend is in progress.
The most recent swing high is somewhat unclear.
The price is currently making new lows.
Trade Strategies
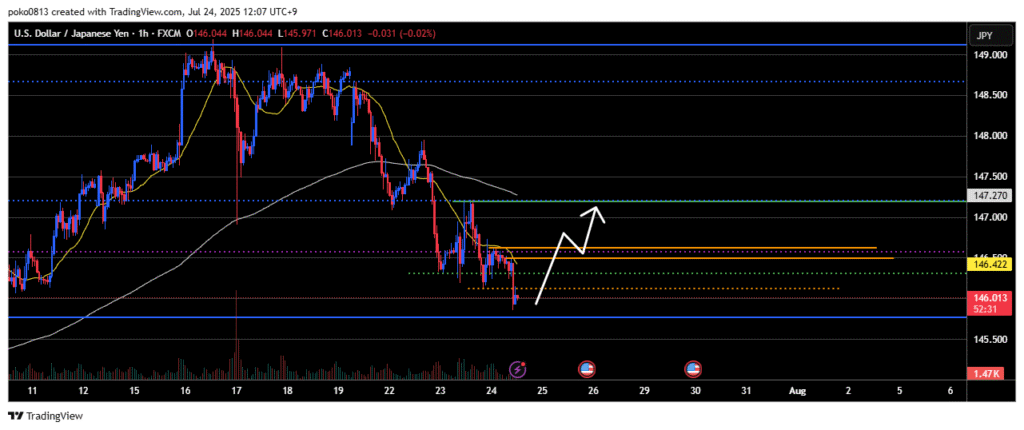
If the market bias shifts upward on the 1-hour chart, I’ll wait for a pullback and look for a long entry on a lower timeframe.
The target take-profit level will be just below the swing high on the 4-hour chart.
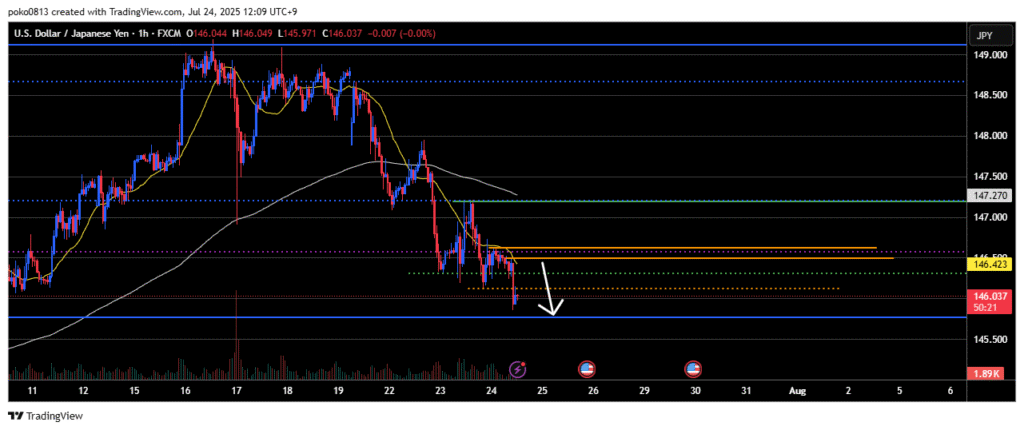
If a pullback occurs and the price returns to the swing high on the 1-hour chart, I’ll consider a short entry from that level.
Price action at that area needs to be carefully monitored.
If the price breaks below the swing low on the daily chart, I’ll be looking for short opportunities.
However, until the daily candlestick closes, there’s a high risk of a false breakout, so caution is required.
Update
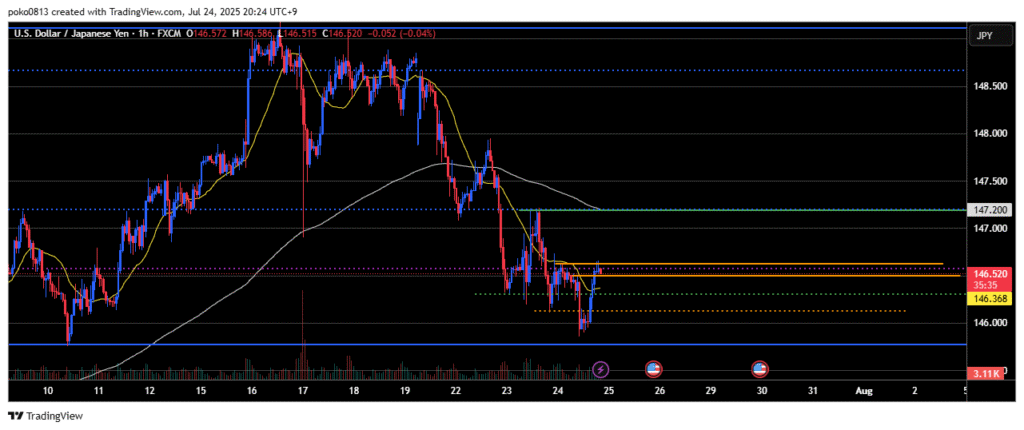
The price has risen up to the last swing high area on the 1-hour chart.
From here, we’ll see whether an upward wave 1 forms on the 1-hour chart or if the price resumes its decline.
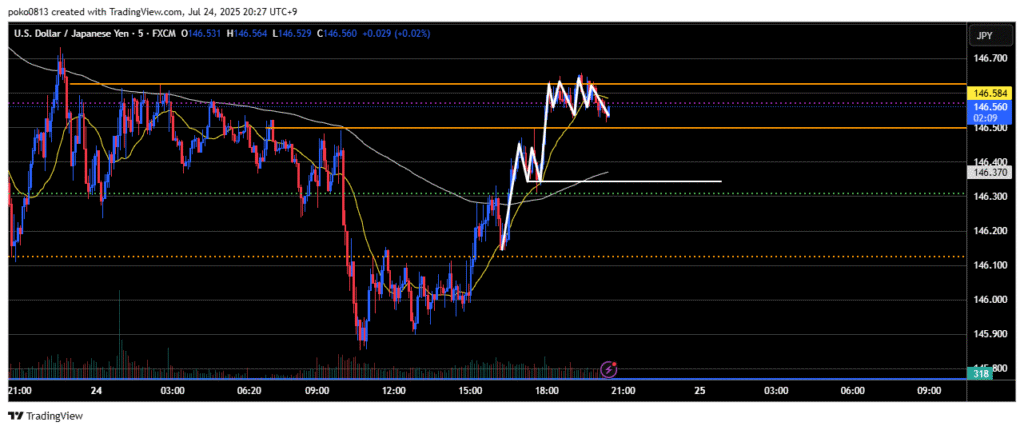
The 5-minute chart is still in an uptrend.
The bullish outlook remains as long as the last swing low isn’t broken.
However, the price has failed to break the recent high and is forming something like a double top.