USDJPY Market Analysis and Trading Strategies.
*Personal Opinion
I use “XMTRADING” as my trading tool.

It is my personal most trusted trading account and is used by many professional traders.
I use “TradingView” as my analysis tool.
Registering an account gives you access to many features for free.
Waveforms of each time leg
Weekly
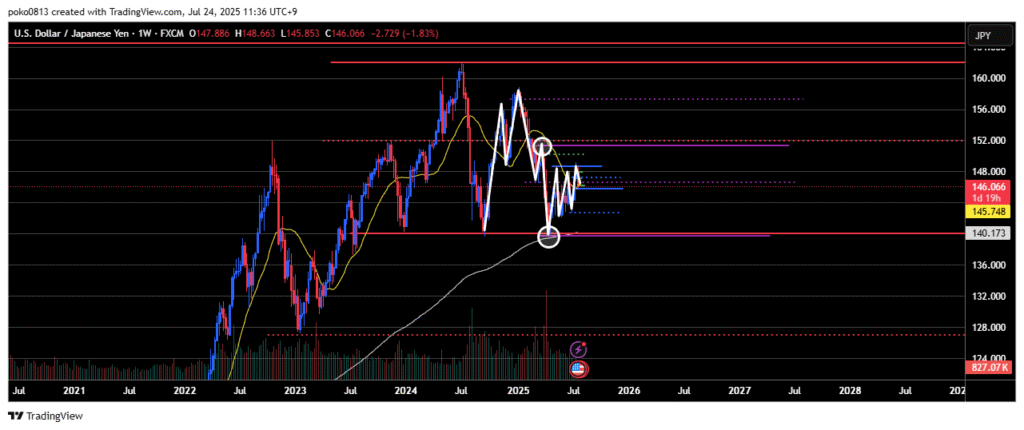
The market is in a downtrend.
There appears to be strong upward pressure on the lower timeframes, but unless the most recent swing high is clearly broken, the overall bias on the weekly chart remains bearish.
It still seems likely that the price could reach the 150 yen level.
Daily
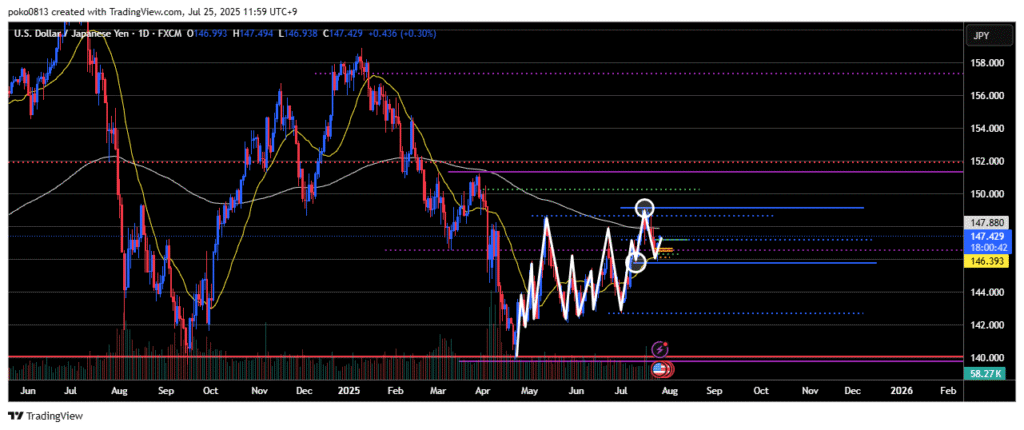
The 148.64 yen level has been broken to the upside with a candlestick body close above it.
Currently, the last confirmed swing low is considered to be at 145.75 yen.
The price dropped to the area around the most recent swing low and has since rebounded.
The question now is whether it will continue upward toward the recent high.
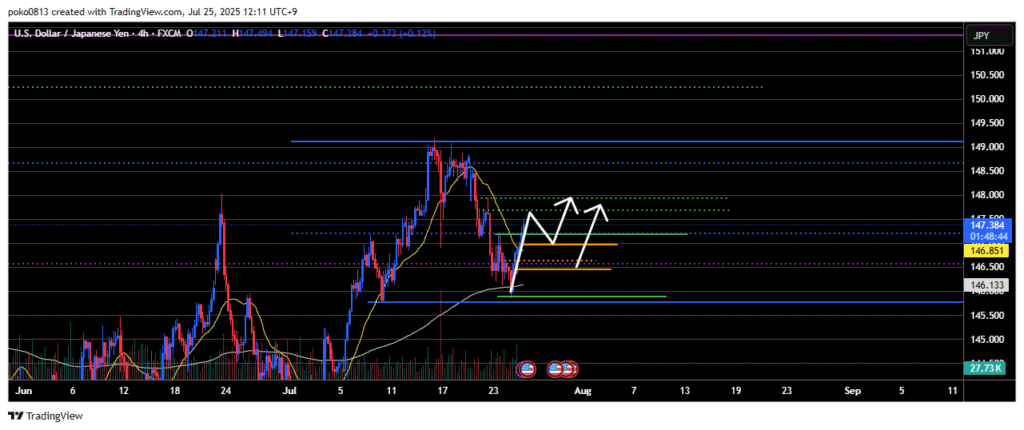
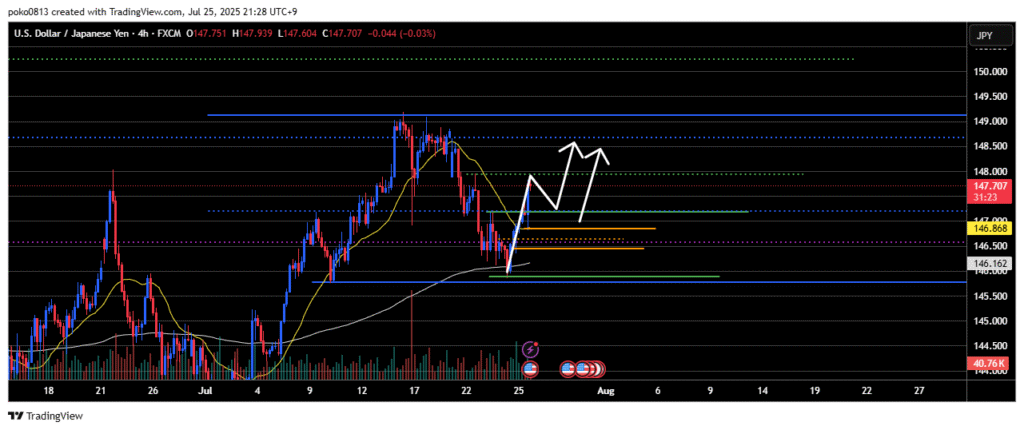
4-Hour
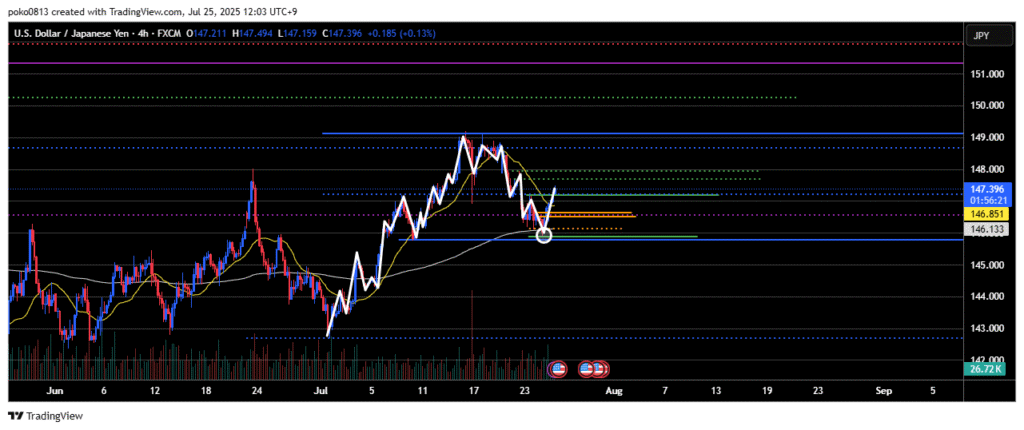
The final swing high of the downtrend has been broken to the upside.
This marks a shift to a bullish outlook.
If this move is considered the 1st wave of a new uptrend, the plan is to wait for the corrective 2nd wave and then look for a buying opportunity on the pullback.
1-Hour
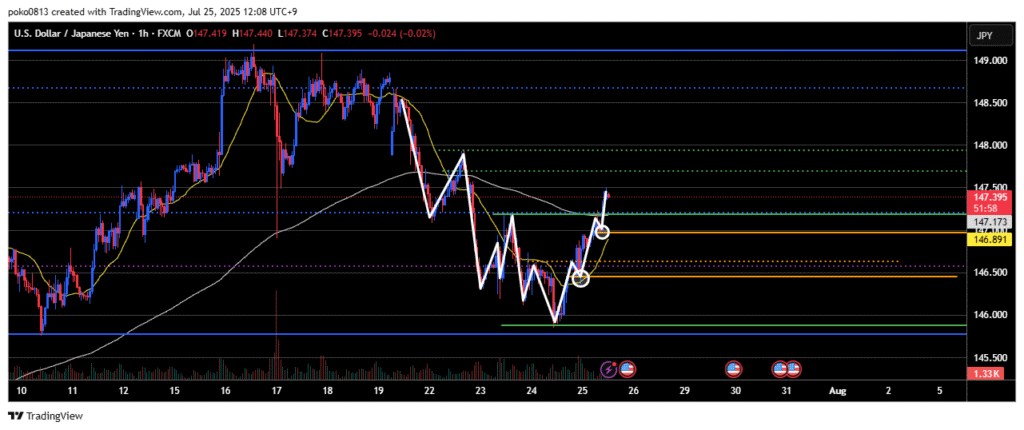
The final swing high of the downtrend has been broken to the upside, shifting the market to a bullish bias.
However, the new swing low is unclear at this stage.
Attention is now on how far this short-term upward wave can extend.
Trade Strategies
There are several important economic indicators being released today in both the UK and the US.
Please exercise caution when trading.
For details, refer to the Economic Calendar on TradingView.
Note: Make sure to adjust for each country’s time zone.
Entered a long position targeting the 3rd wave of the uptrend.
Watching closely to see how long the 2nd wave correction will continue.
While there’s a possibility that the price could keep rising from here, I’m expecting a significant pullback at some point.
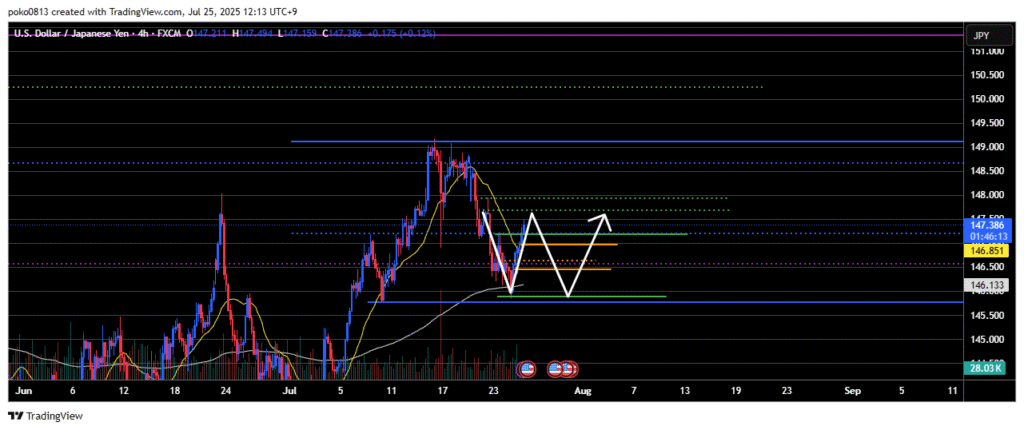
There’s a possibility that a double bottom like this could form.
As long as the price doesn’t fall below the starting point of the current wave on the 4-hour chart, my outlook remains bullish.
However, based on the previous price structures, I believe it’s unlikely that such a large double bottom will actually form.
Depending on where the most recent swing low on the 1-hour chart is, a shift to a bearish outlook on the 1-hour timeframe could allow for a short entry aimed at capturing the 2nd corrective wave of the 4-hour uptrend.
However, take-profit levels are unclear, and the risk-to-reward ratio is likely to be unfavorable.
For those who are eager to trade right now, it might be possible to ride the short-term trend by targeting the 1st wave of the uptrend.
However, since the potential upside is uncertain, this approach is not particularly recommended.
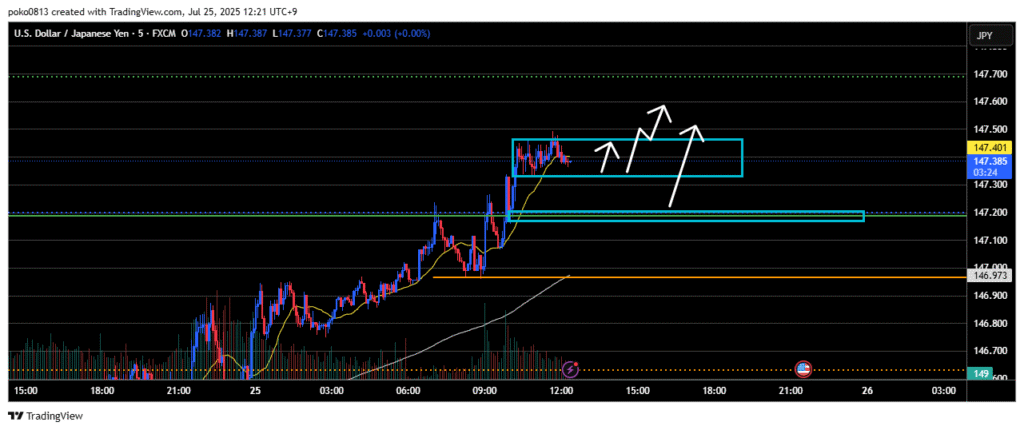
A possible setup would be a long entry from the lower boundary of the current 5-minute range.
As long as the price doesn’t break below the most recent swing low on the 5-minute chart, buying opportunities can still be considered.
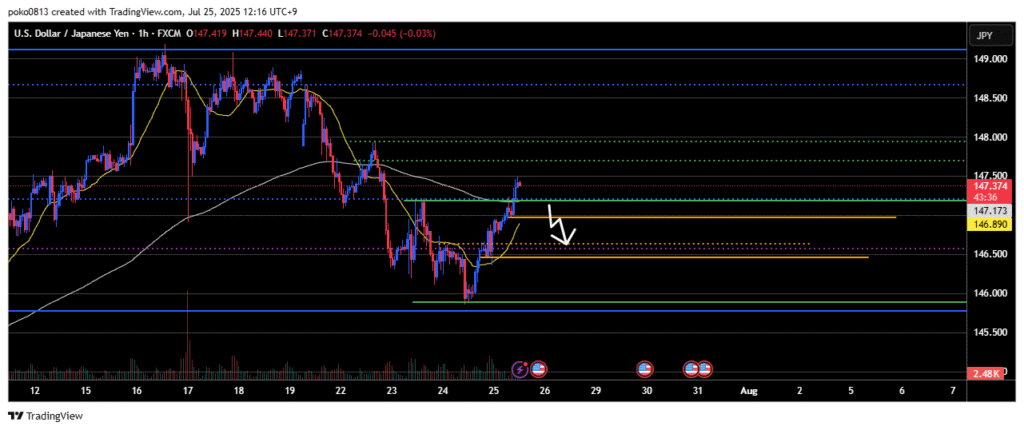
Update
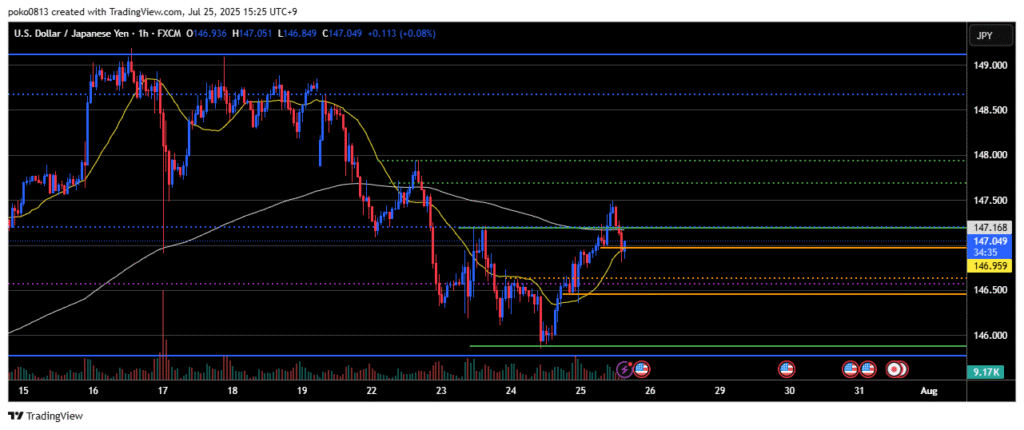
This is the 1-hour chart, and it looks like the market has entered a correction phase.
There may be a temporary increase in selling pressure on the lower timeframes.
Update2
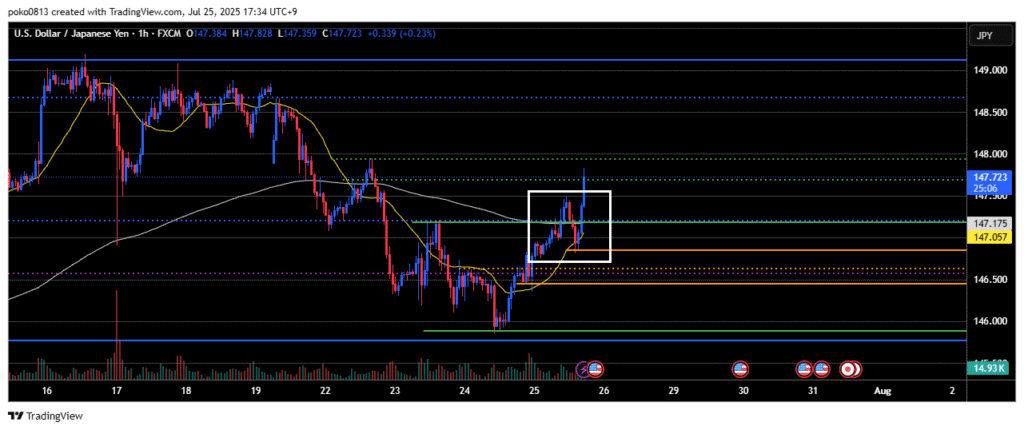
The recent high has been broken on the 1-hour chart.
This confirms a clear swing low.
It’s reasonable to say that the first upward wave on the 4-hour chart is still in progress.
The key now is to watch how far this upward move can extend and when the correction phase will begin.
The price is currently approaching a notable resistance line, where profit-taking and new sell orders are likely to emerge.
If the outlook shifts bearish on the 1-hour chart, I’ll consider a short position to target the second corrective wave on the 4-hour chart.
Update3
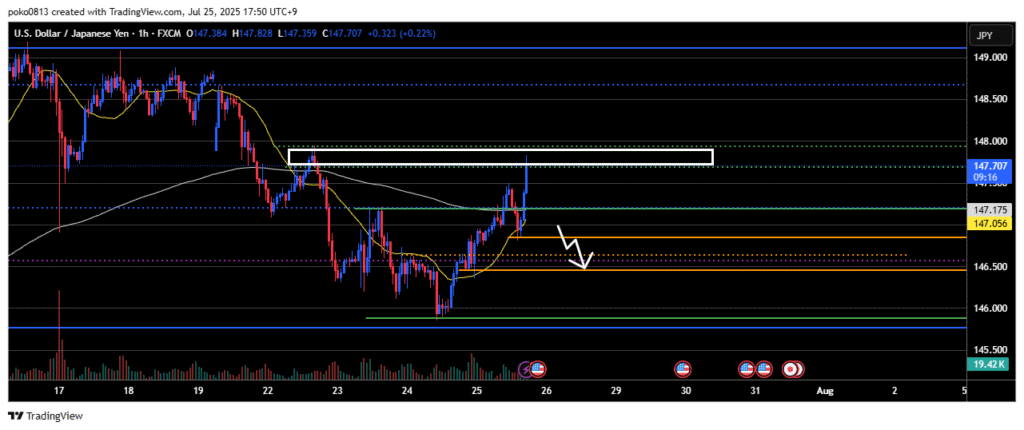
We may be entering the correction phase soon.
It’s likely that the price won’t return all the way to the previous swing low area on the 1-hour chart, which I had originally anticipated.
Keep a close eye on the price action around the trend shift line on the 4-hour chart and the last swing low on the 1-hour chart.