USDJPY Market Analysis and Trading Strategies.
*Personal Opinion
I use “XMTRADING” as my trading tool.

It is my personal most trusted trading account and is used by many professional traders.
I use “TradingView” as my analysis tool.
Registering an account gives you access to many features for free.
Waveforms of each time leg
Weekly
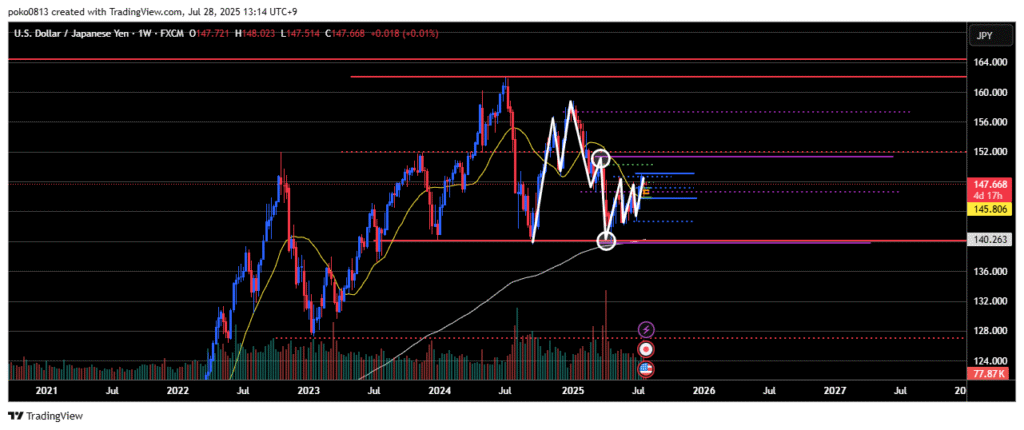
A downtrend is currently in place.
Price is moving within the range between the recent low and the last swing high.
While the weekly chart maintains a bearish outlook, lower timeframes are showing an active uptrend, with price rising toward the most recent swing high on the weekly chart.
Daily
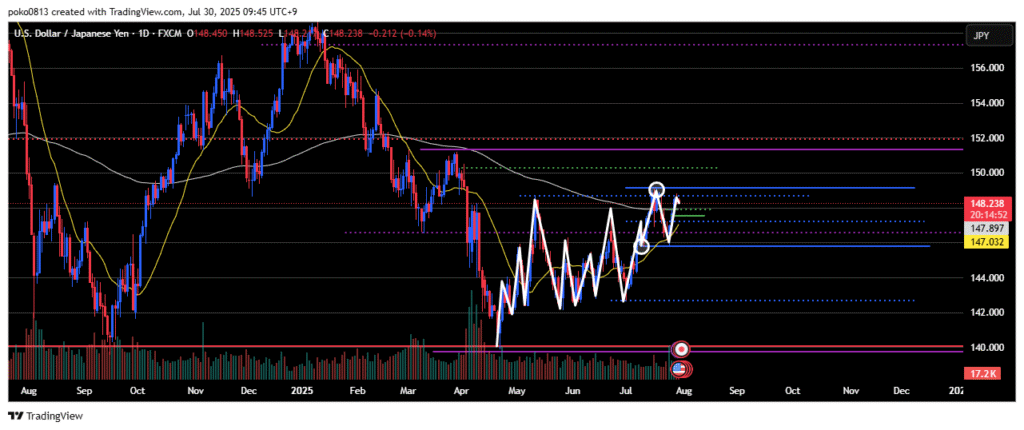
Higher highs and higher lows are forming, confirming an ongoing uptrend.
After a significant pullback down to the area around the most recent swing low, the price is now rising again, aiming for the recent high.
The key question is whether that recent high will act as a top and trigger a reversal, or if the price will break above and move into the 150 yen range.
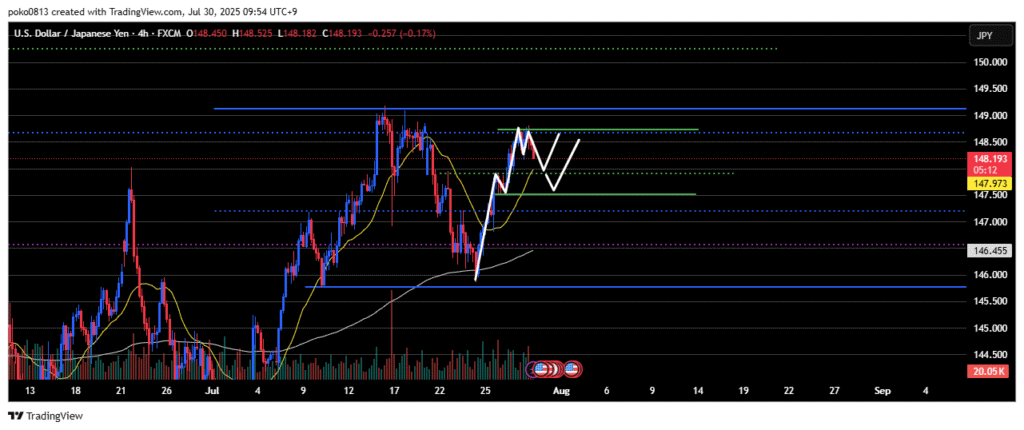
4-Hour
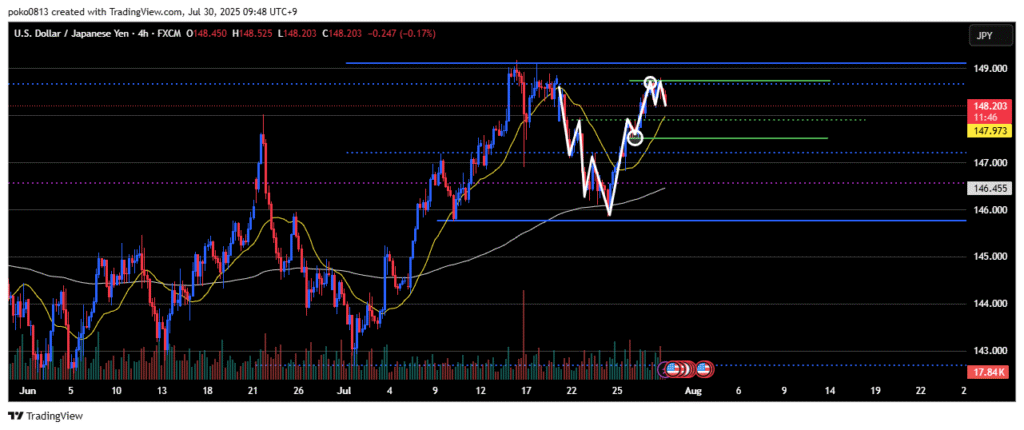
The market is forming an uptrend, with higher highs and higher lows.
It appears to be in the third wave of an Elliott Wave upward move, but the price is currently being capped at the recent daily high.
1-Hour
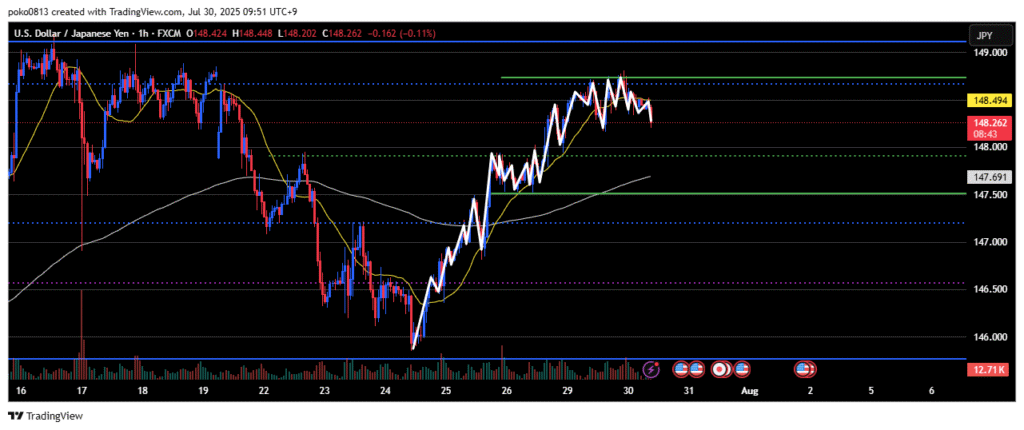
The market is currently unclear in terms of direction—neither clearly bullish nor bearish.
In the short term, however, a downtrend has formed on the lower timeframes.
Trade Strategies
Entered a buy-the-dip position, expecting support at the previous high on the 4-hour chart.
As long as the price doesn’t clearly break below the last swing low of the 4-hour uptrend, I’ll continue looking for buy-the-dip opportunities.
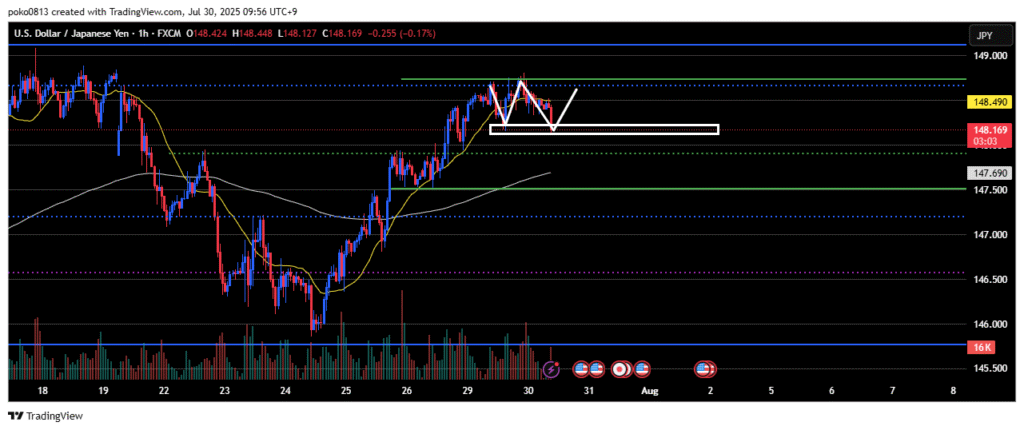
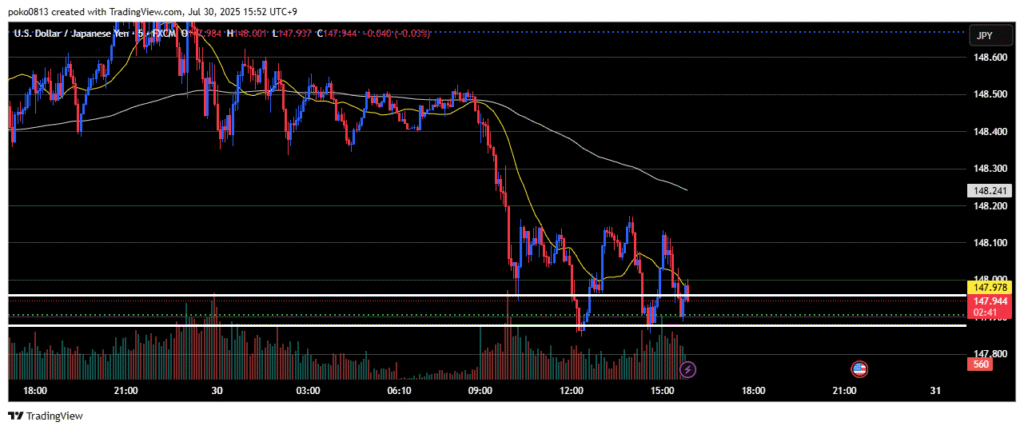
I was considering a buy-the-dip entry around the price zone shown in the image, but the downward momentum on the lower timeframes is strong, so I plan to hold off.
Update
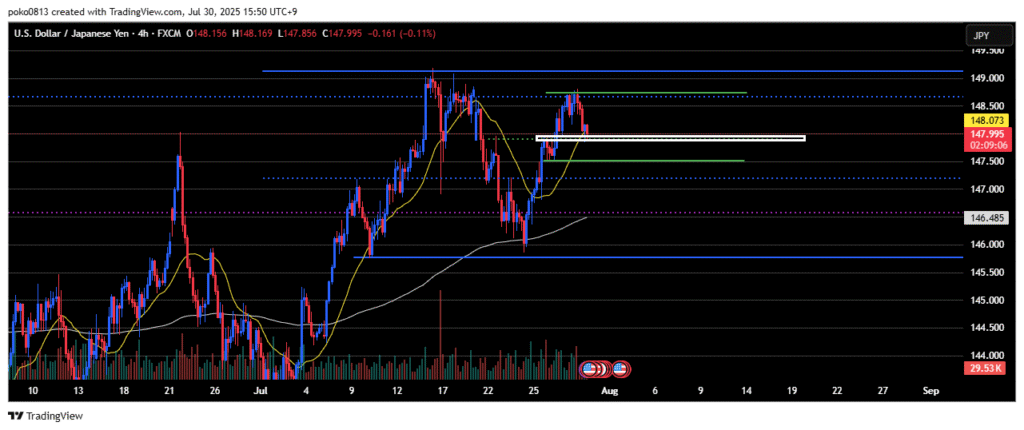
The price has reached the previous high line on the 4-hour chart.
A range is forming on the 5-minute chart, and price action is very choppy.
The selling pressure is stronger than expected.
The market might be building up momentum here for an upward breakout, but if it drops below the current range support, it will likely fall toward the last swing low area on the 4-hour chart.