
USDJPY Market Analysis and Trading Strategies.
*Personal Opinion
I use “XMTRADING” as my trading tool.

It is my personal most trusted trading account and is used by many professional traders.
I use “TradingView” as my analysis tool.
Registering an account gives you access to many features for free.
Waveforms of each time leg
Weekly
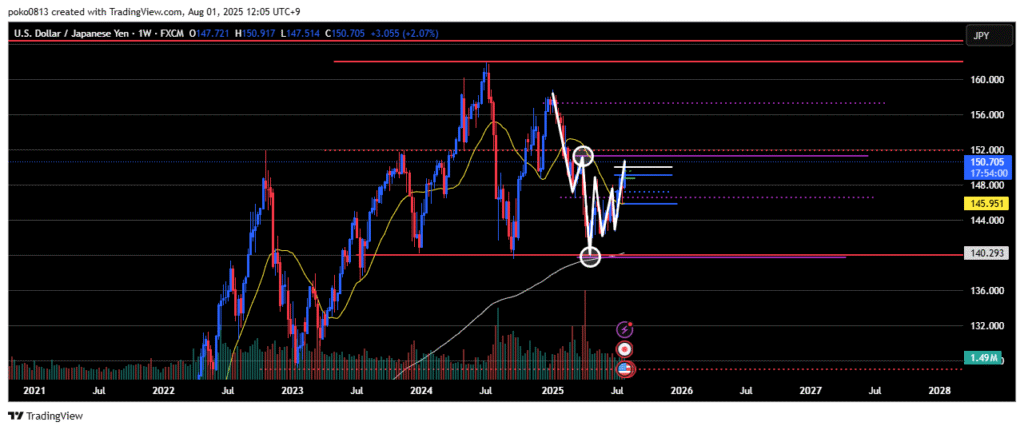
At this point, the final swing high of the downtrend has not been clearly broken, so the weekly outlook remains bearish.
How the current candlestick closes could significantly influence the overall market direction.
Daily
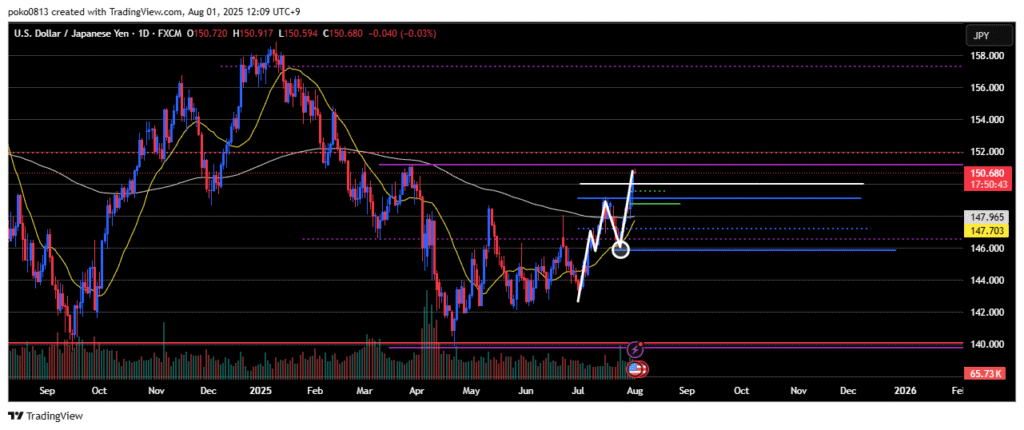
An uptrend is in place.
The price has broken above the 150 yen level and is now approaching the swing high area on the weekly chart.
4-Hour
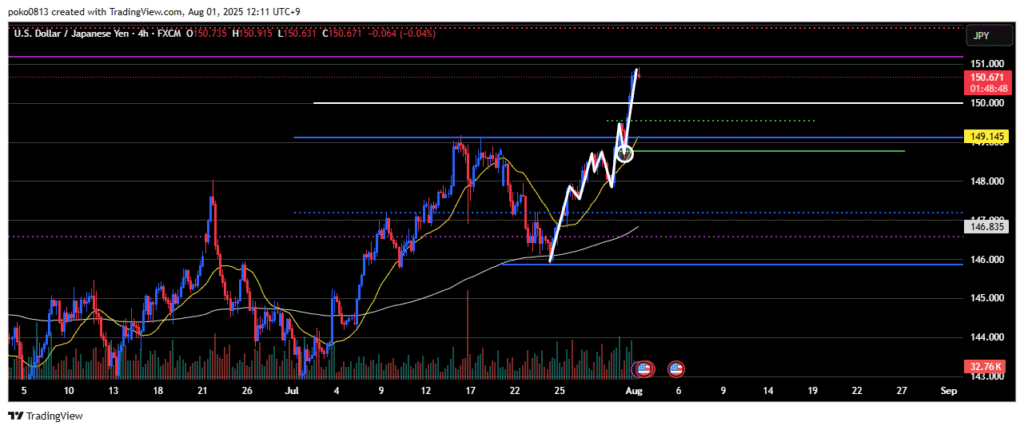
An uptrend is ongoing.
There was a strong move up yesterday, but currently, momentum appears to be slowing on the lower timeframes, suggesting that the bullish momentum may be starting to fade.
The key now is whether the market will enter a clear correction phase from here.
1-Hour
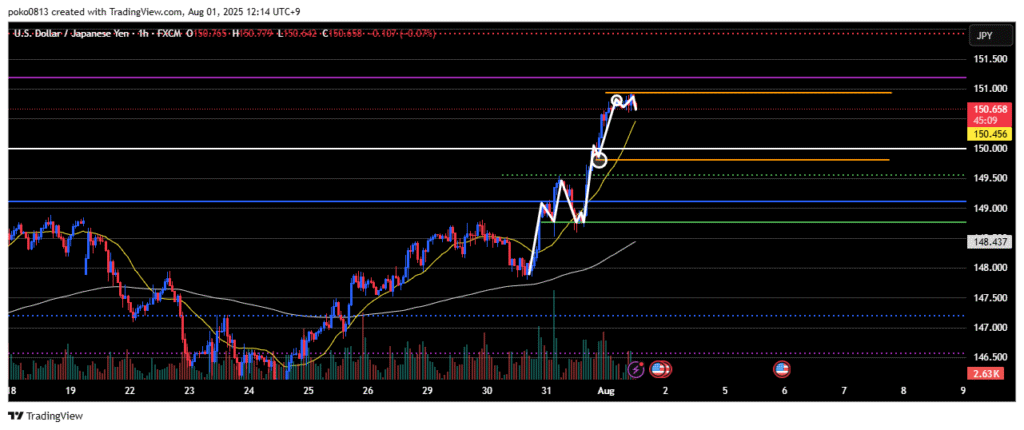
The recent price swings are relatively narrow and lack a clearly defined swing low that many traders would likely focus on.
Given this, it may be more effective to analyze the chart using the 4-hour timeframe as the primary reference.
Trade Strategies
The U.S. Non-Farm Payrolls (NFP) report is scheduled for release today.
This is a major economic event that can cause significant volatility across the markets, especially in USD-related pairs.
If you’re trading today, be mindful of:
- Sharp price swings around the release time
- Potential for false breakouts before and after the news
- Wider spreads and slippage, especially on lower timeframes
Consider managing your risk carefully—either by adjusting position size, setting wider stops, or waiting until after the market digests the data before entering new trades.
For details, refer to the Economic Calendar on TradingView.
Note: Make sure to adjust for each country’s time zone.
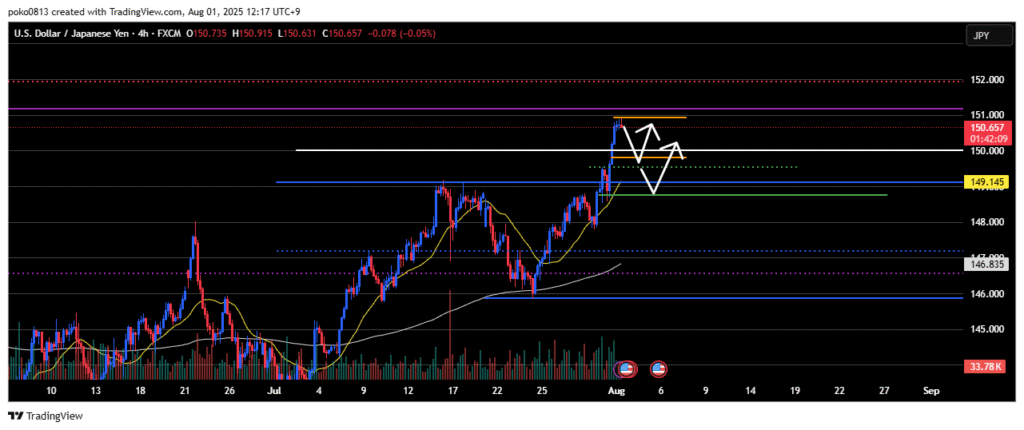
Considering a potential buy on the dip around the previous high area on the 4-hour chart.
As long as the price doesn’t break below the most recent swing low on the 4-hour chart, the outlook remains bullish for today.
Also keeping an eye on the 21-period moving average on the 4-hour chart.
It may act as dynamic support and could align with potential pullback zones, adding confluence to a buy-on-the-dip strategy.
Update
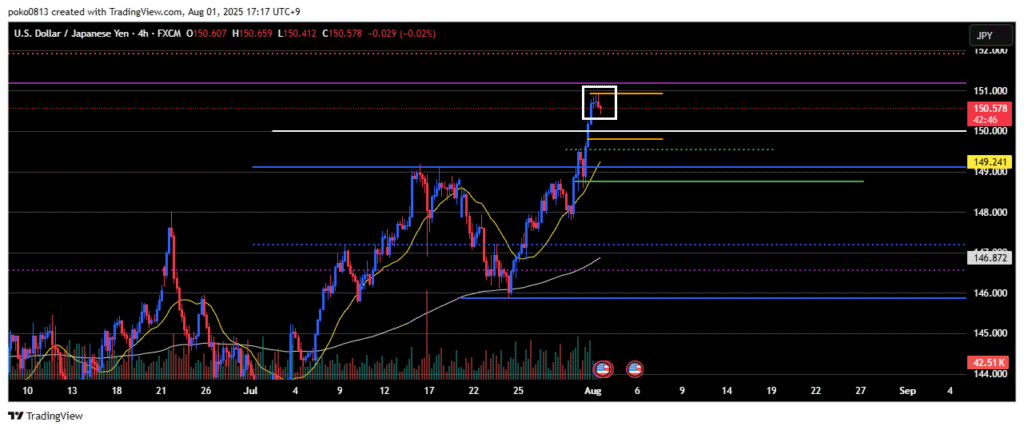
There’s been almost no price movement since this morning.
It feels like a correction may be starting, but the market isn’t pulling back as expected.
Update2
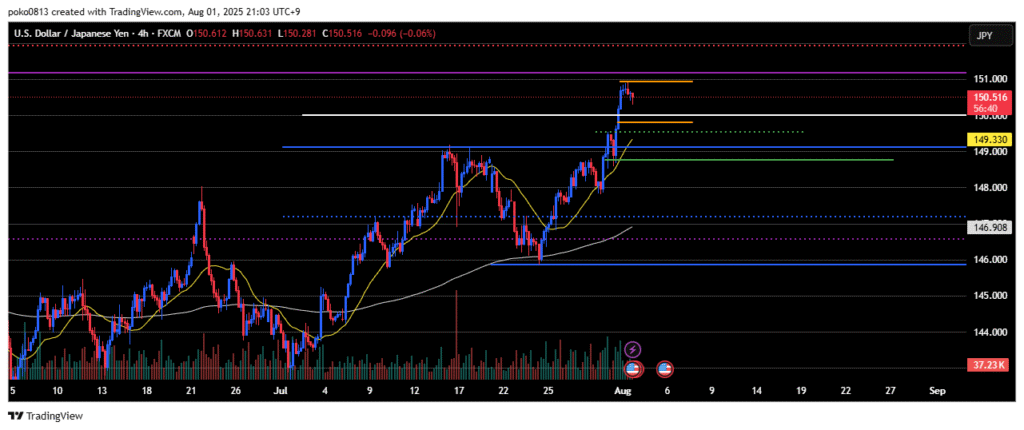
There’s been almost no price movement throughout the day.
With the U.S. Non-Farm Payrolls report coming up and the weekend approaching, I’d prefer not to hold any positions over into next week.
So I’ve decided to stay out of the market for now.