USDJPY Market Analysis and Trading Strategies.
*Personal Opinion
I use “XMTRADING” as my trading tool.

It is my personal most trusted trading account and is used by many professional traders.
I use “TradingView” as my analysis tool.
Registering an account gives you access to many features for free.
Waveforms of each time leg
Weekly
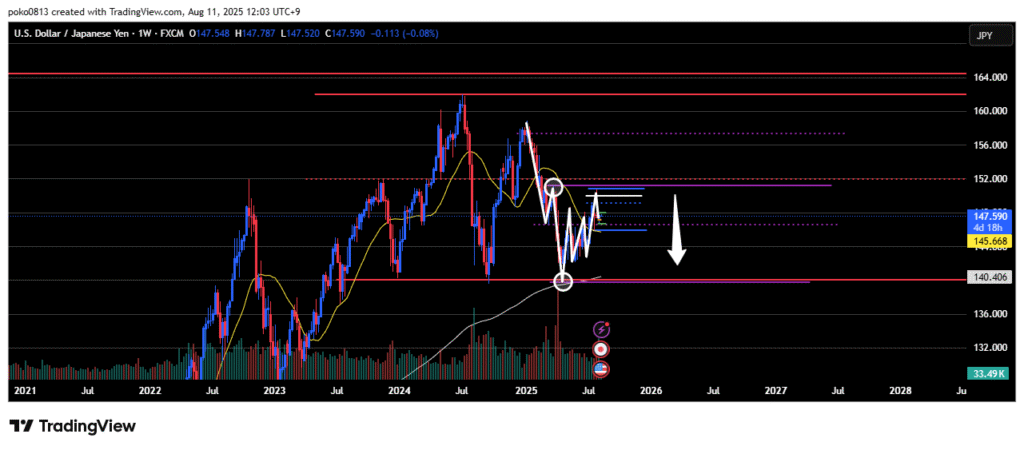
Downtrend.
The price rose to the last swing high line but bounced at that price level.
The bias remains bearish unless the last swing high line is clearly broken to the upside.
Daily
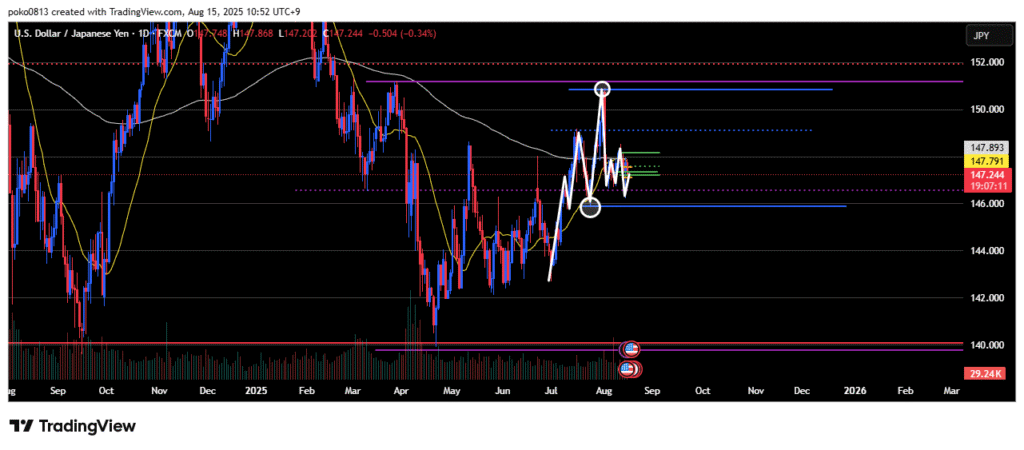
Uptrend.
Looking at the recent price action, the market initially attempted to rise, but then fell back to the most recent swing low line before rebounding.
The outlook remains bullish until the most recent swing low line is clearly broken to the downside.
4-Hour
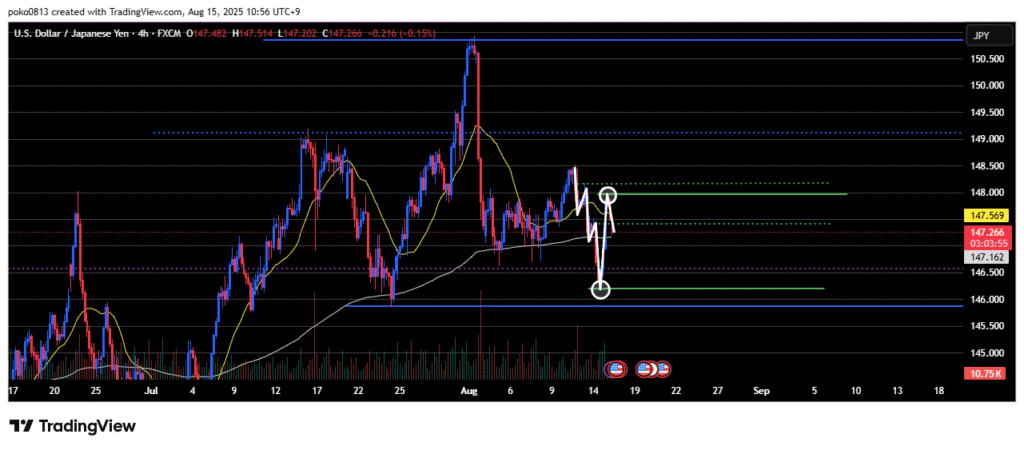
An initial upward wave has formed, breaking the recent downtrend.
The market now appears to be in the second (corrective) wave.
Assuming this is the second wave of an uptrend, it is unclear how far the correction will continue.
The outlook remains bullish until the line marking the origin of the most recent high is clearly broken to the downside.
1-Hour
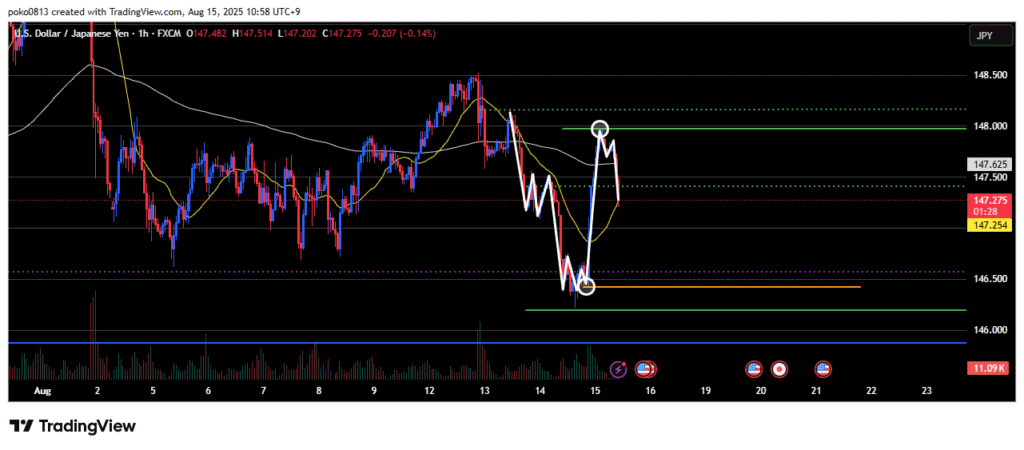
Just like on the 4-hour chart, an initial upward wave has formed, breaking the downtrend.
On the 1-hour chart as well, the outlook remains bullish until the line marking the origin of the most recent high is clearly broken to the downside.
Currently, a downtrend is developing on the lower timeframes.
Trade Strategies
There is also an important U.S. economic data release scheduled for today.
For details, refer to the Economic Calendar on TradingView.
Note: Make sure to adjust for each country’s time zone.
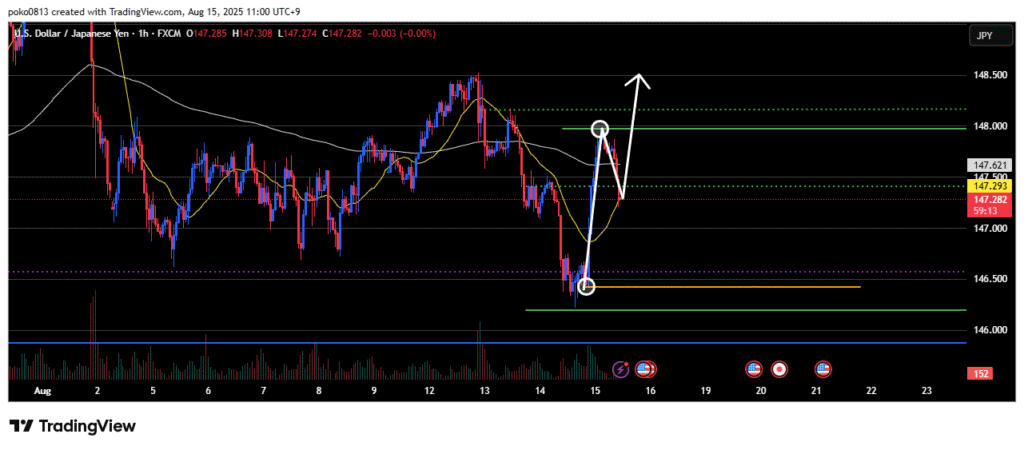
Buying the dip in anticipation of the Elliott Wave upward Wave 3.
It is unclear how far the Wave 2 correction will continue.
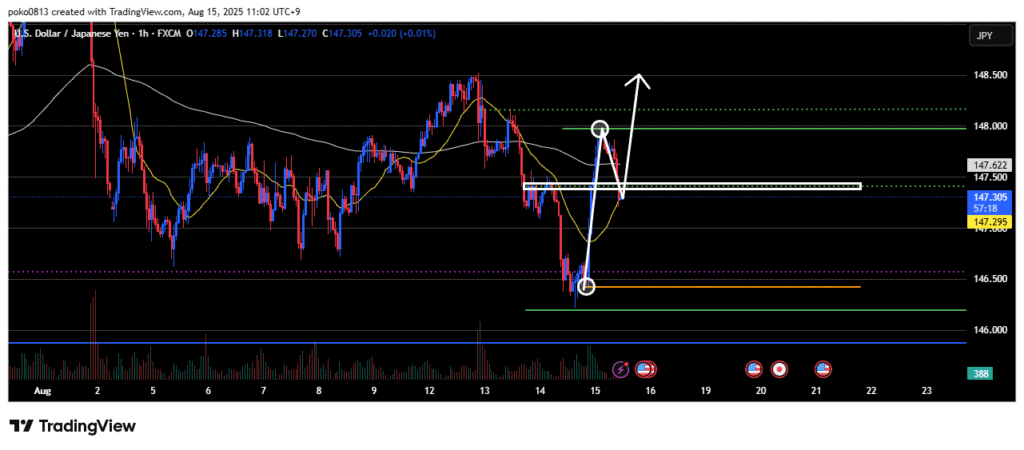
The price zone shown in the image is the 4-hour trend reversal line, which I anticipated would be respected, but the downward momentum on the lower timeframes seems relatively strong.
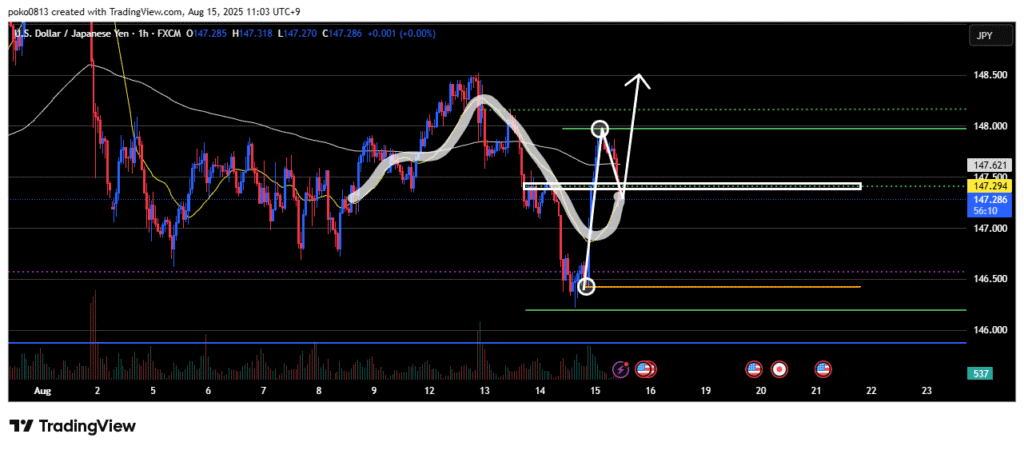
The 21-period moving average on the 1-hour chart, which has been respected recently, also happens to align with this price zone, so I’ll be paying close attention to the price action here.