
USDJPY Market Analysis and Trading Strategies.
*Personal Opinion
I use “XMTRADING” as my trading tool.

It is my personal most trusted trading account and is used by many professional traders.
I use “TradingView” as my analysis tool.
Registering an account gives you access to many features for free.
Waveforms of each time leg
Weekly
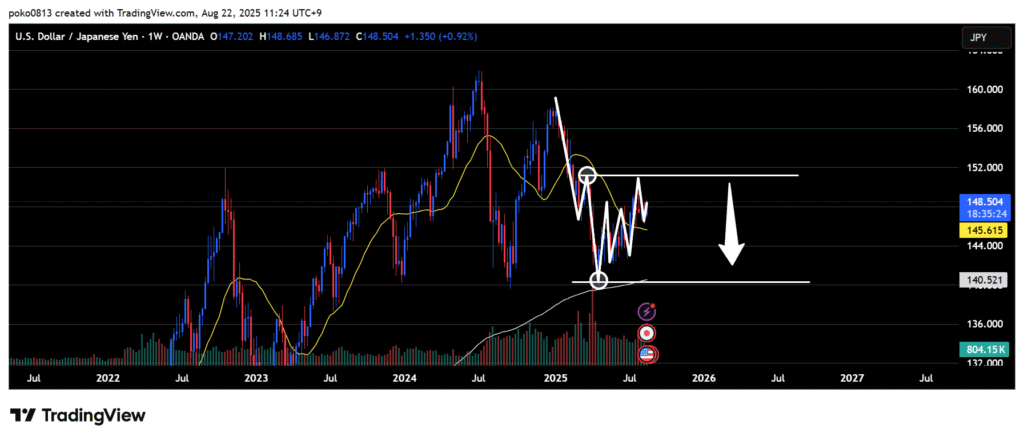
Downtrend.
Within the price range between the most recent low and the last swing high, an uptrend has formed on the lower timeframes.
On the weekly chart, the outlook remains bearish until the last swing high line is clearly broken to the upside.
Daily
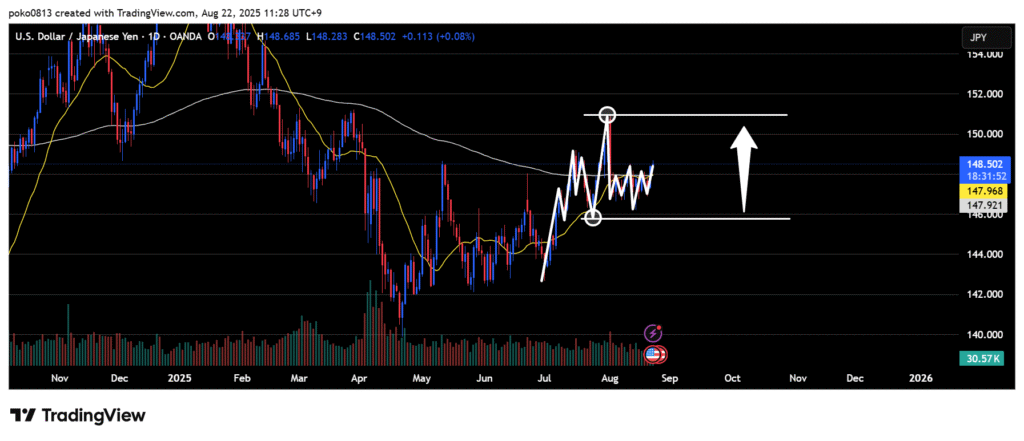
Uptrend.
As long as the last swing low line is not clearly broken to the downside,
the daily outlook remains bullish.
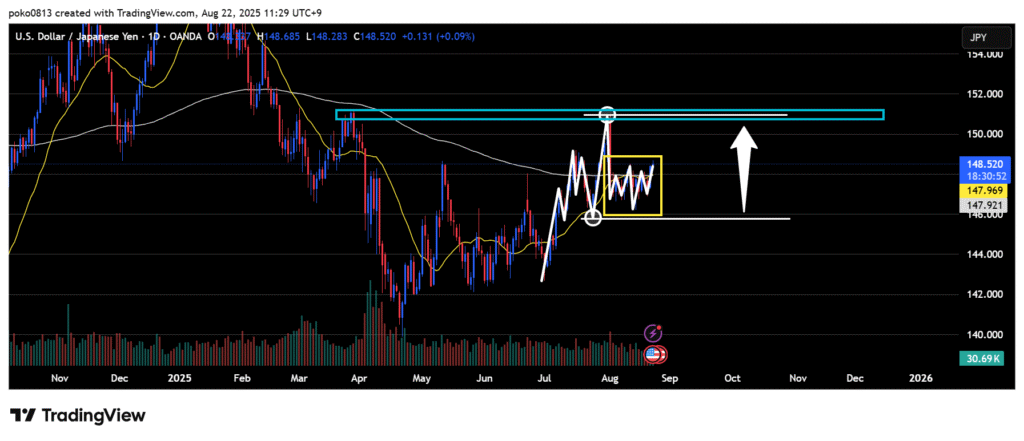
The price strongly rebounded at the weekly swing high line, and a range is currently forming.
There is still no clear sense of direction.
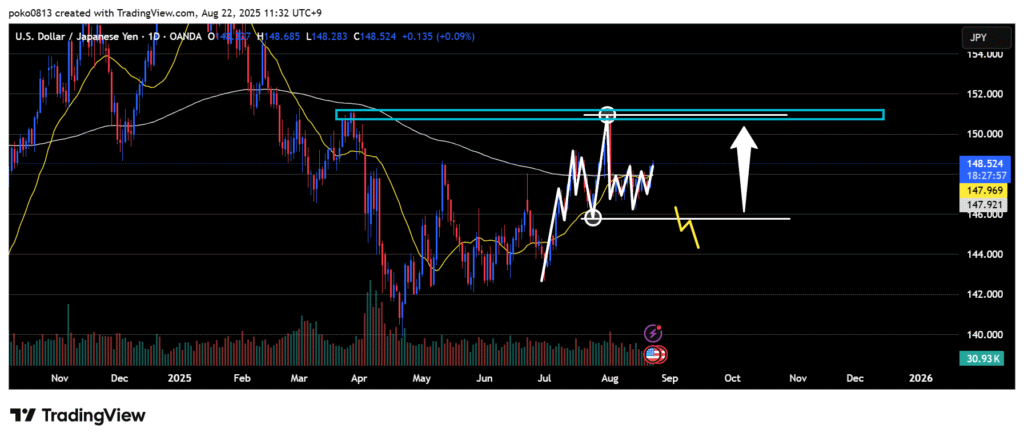
If the price clearly breaks below the last swing low on the daily chart, the downward bias is likely to strengthen.
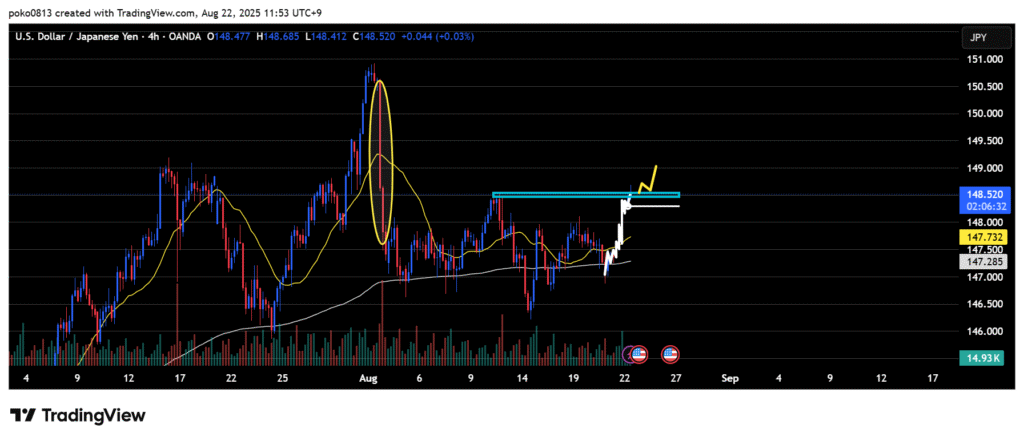
4-Hour
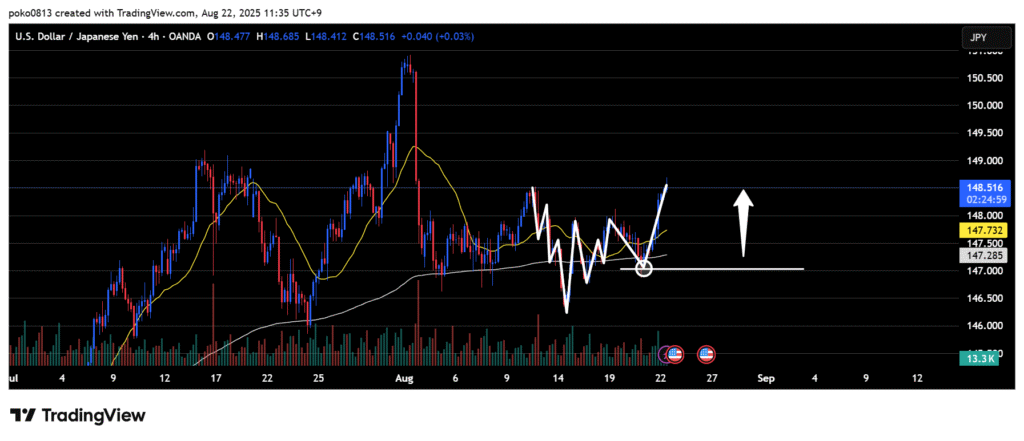
Uptrend.
The outlook remains bullish until the last swing low line is clearly broken to the downside.
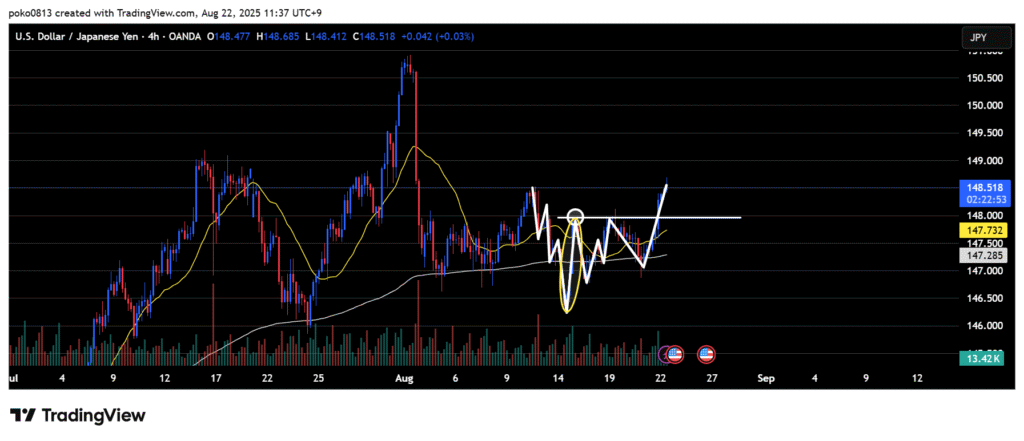
An initial upward Wave 1 broke the downtrend, and I was expecting an upward Wave 3 to form, but the upside was heavy and the price bounced once.
However, the recent high was finally broken, and the upward Wave 3 began.
It’s unclear how far the price will extend, but it has now reached a price zone that could act as resistance, so there is a possibility of a temporary rebound here.
1-Hour
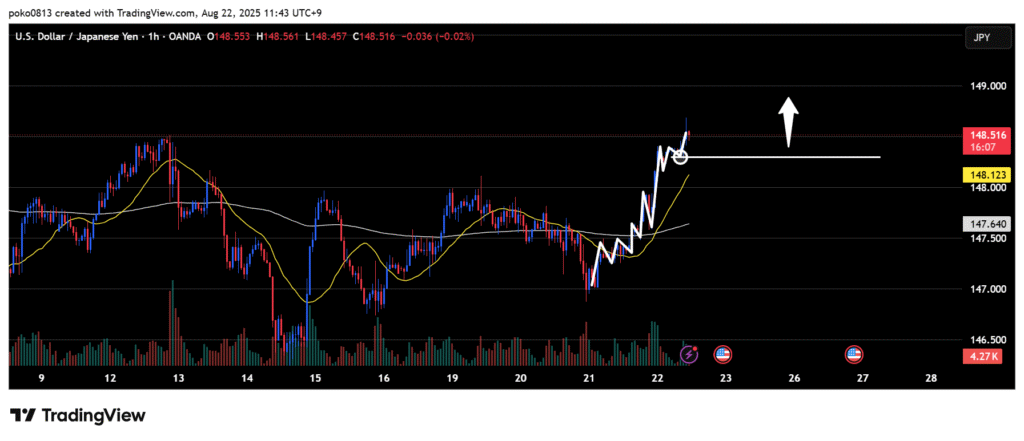
Uptrend.
Since the recent high has been broken with a candle body close, the outlook remains bullish until the pullback low line shown in the image is clearly broken to the downside.
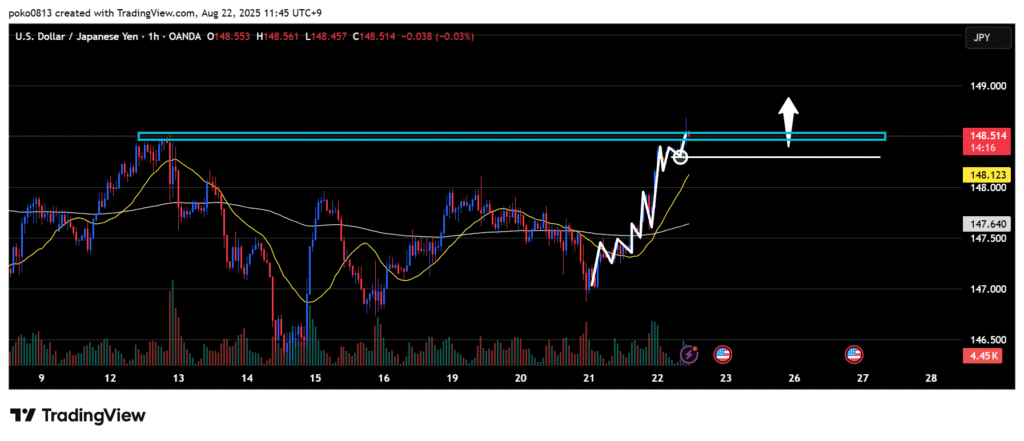
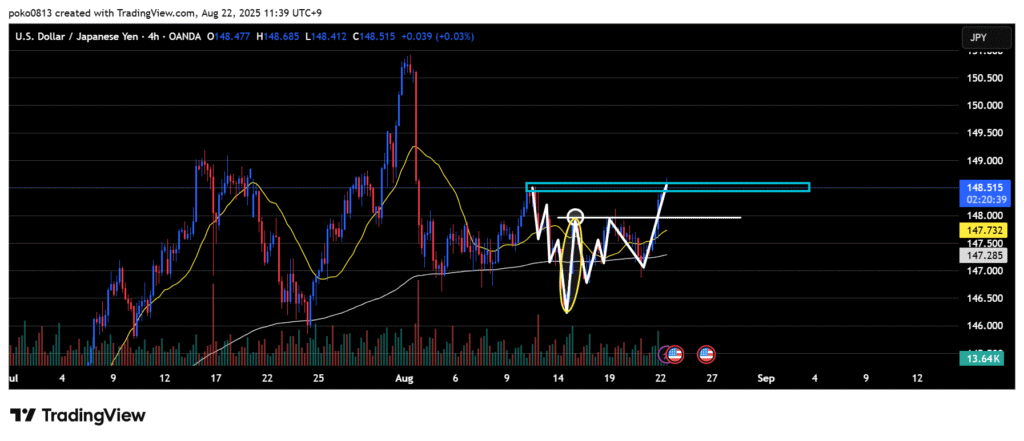
The blue price zone shown in the image is likely to be a significant level on the 4-hour chart as well, so there is a possibility of a rebound and downward move from here.
Trade Strategies

If the price falls to the last pullback low on the 1-hour chart, I will consider a pullback buy.
The 21-period moving average on the 1-hour chart may also overlap at that level.
However, the upward Wave 3 on the 4-hour chart may have already extended fully, so a reversal from here is also possible.
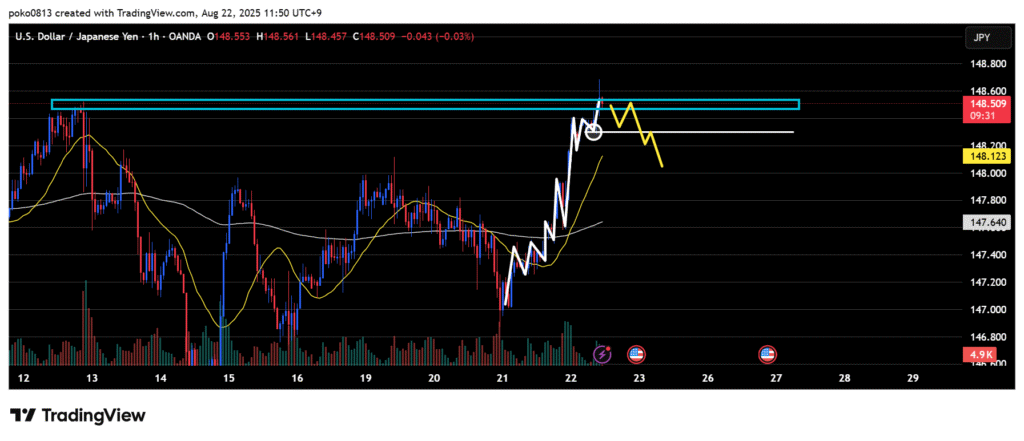
If the price breaks below the last pullback low on the 1-hour chart, I will look for a short on the lower time frames.
The rationale becomes stronger if a double top or similar pattern forms.
Since this targets the corrective Wave 4 of the 4-hour uptrend, be aware that the price may move sideways or risk being caught in an upward Wave 5.
If the price clearly breaks above the blue price zone on the 4-hour chart with a candle body close, I will target further upward movement.
There is a possibility of a rebound at round-number levels or other key levels.
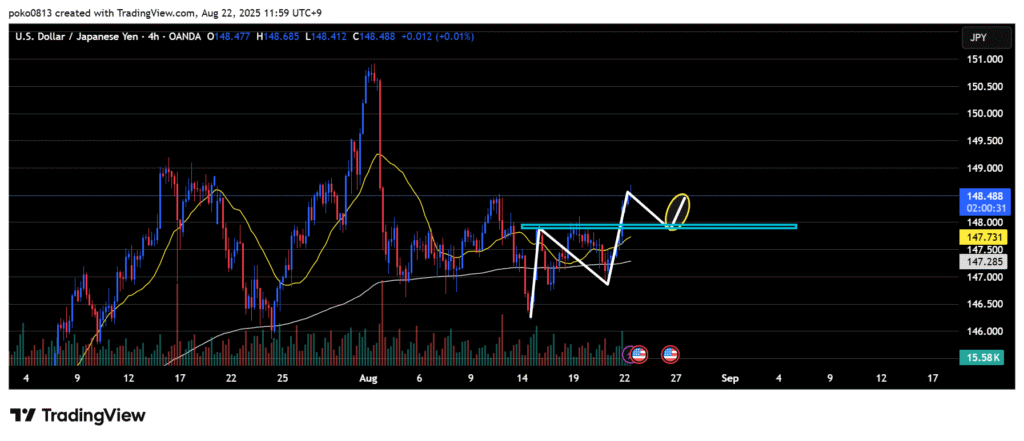
I am also considering a pullback buy targeting the 5th upward wave on the 4-hour chart.
The price zone I am watching is at the end of Wave 1, a level that has been closely respected recently.