USDJPY Market Analysis and Trading Strategies.
*Personal Opinion
I use “XMTRADING” as my trading tool.

It is my personal most trusted trading account and is used by many professional traders.
I use “TradingView” as my analysis tool.
Registering an account gives you access to many features for free.
Waveforms of each time leg
Weekly
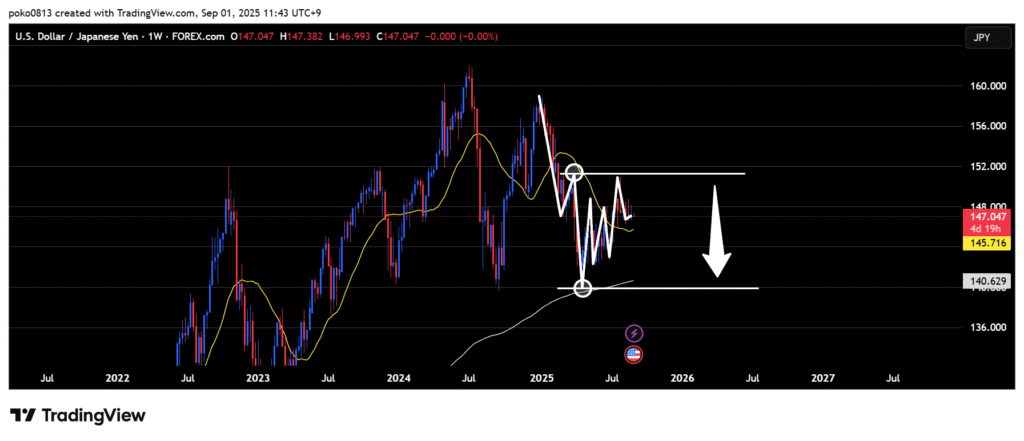
Downtrend.
Within the range between the recent low and the last swing high, an uptrend has formed on the lower time frames.
The price once rose to the last swing high line but failed to break above it and rebounded.
The outlook remains bearish until the last swing high line is clearly broken to the upside.
Daily
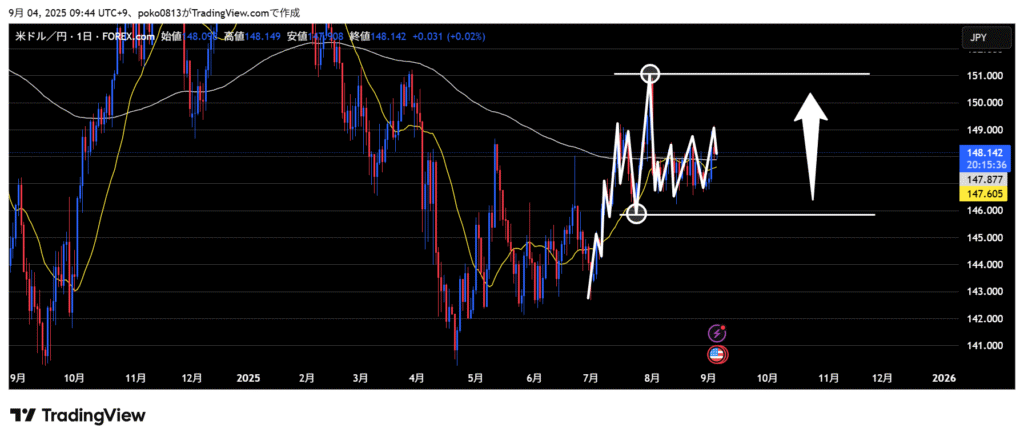
Uptrend.
After falling to around the last swing low line, a range has formed on the lower time frames.
The outlook remains bullish until the last swing low line is clearly broken to the downside.
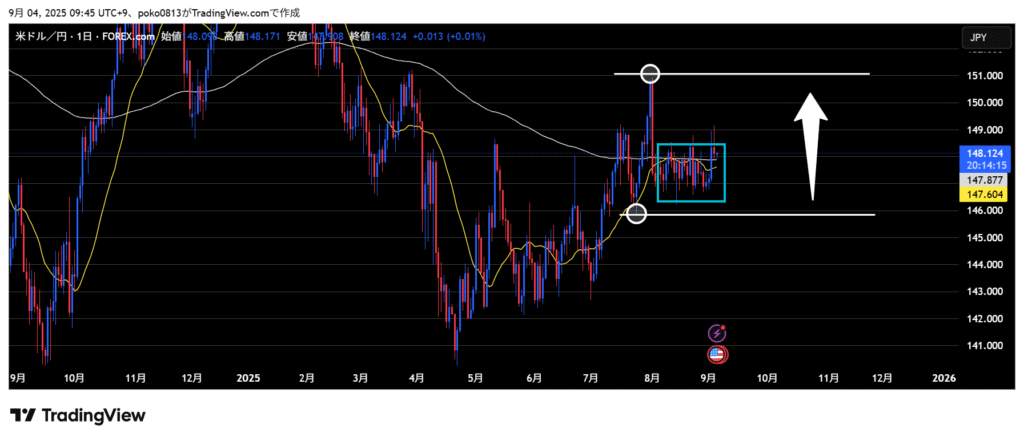
Recently, a range has formed, and the candlestick bodies have not been able to break above it.
4-Hour
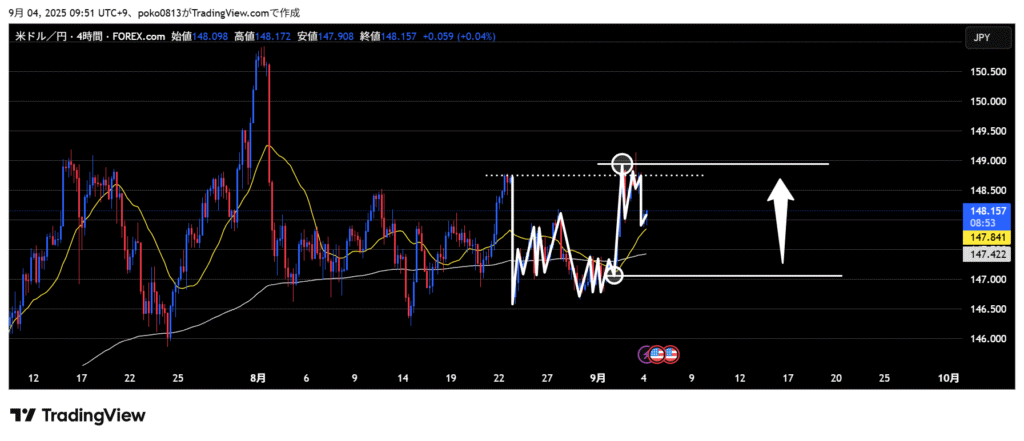
The candlestick bodies have broken above the starting point of the recent sharp drop, shifting the outlook to bullish.
Since the candlestick bodies have not yet broken the recent high, the outlook will remain bullish until the price clearly breaks below the starting line that created the recent high.
If the recent swing is considered the first upward wave, the question is whether the third upward wave will emerge next.
I will also pay attention to the price action around the 21-period moving average on the 4-hour chart.
1-Hour
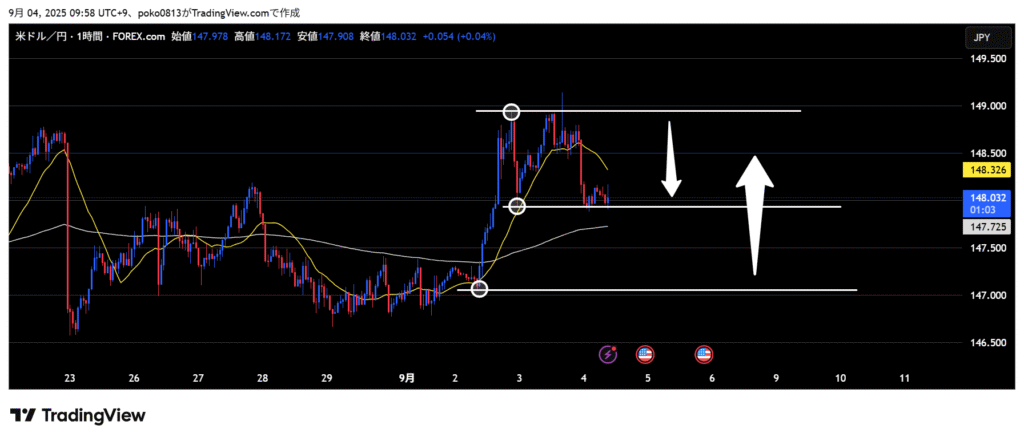
On the 1-hour chart, the market can be viewed as either bullish or bearish.
If the middle line in the image above is broken to the downside, there is a possibility of a sharp drop, provided it is not a false breakout.
Trade Strategies
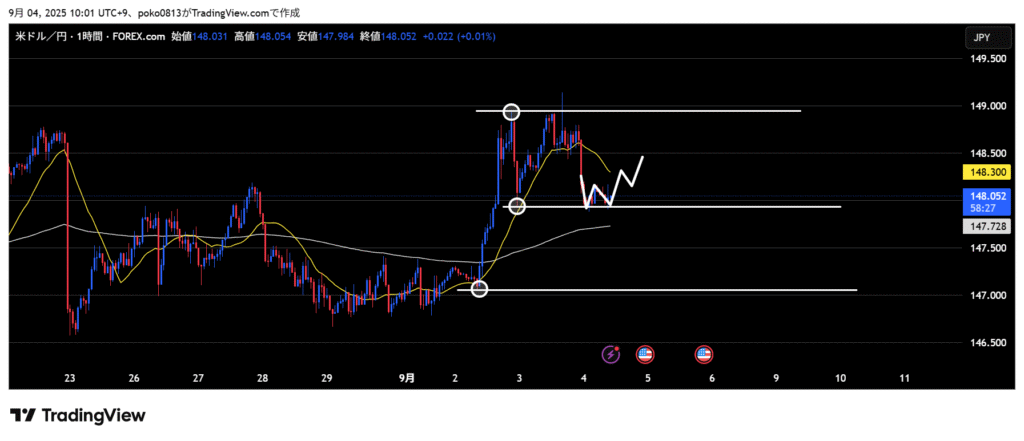
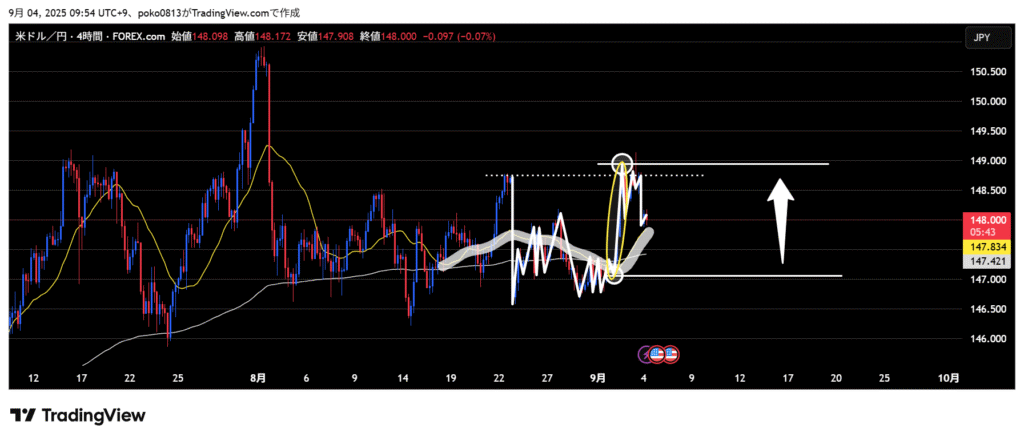
I will look for a long entry aiming for the third upward wave on the 4-hour chart.
There is a possibility that a chart pattern such as a double bottom may form.
I will also keep an eye on the 21-period moving average on the 4-hour chart, which was noted earlier.
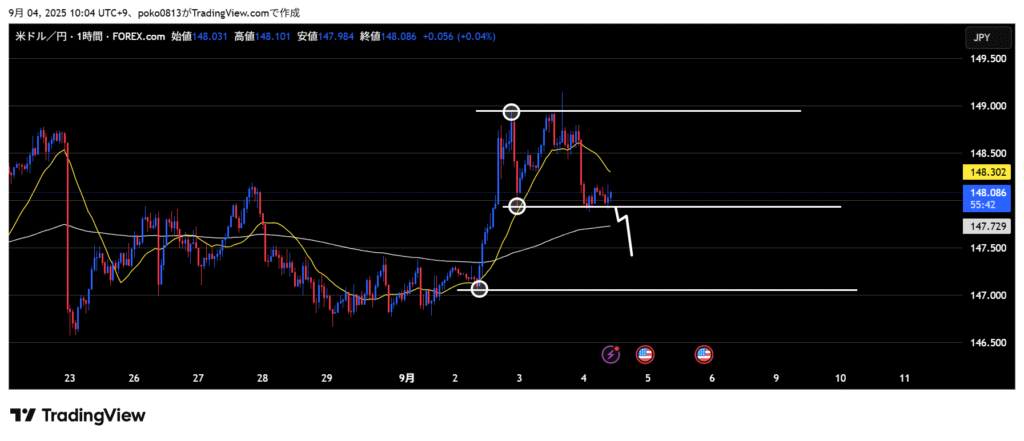
If the downward momentum is strong and volatility is high, I will look for a short entry.
If volatility is low, there is a high possibility of a false breakout.